Shopify Prospecting by Region [6M-Store Study]
Prioritize qualified Shopify stores over raw counts: use country, revenue tiers, and recent change signals to build targeted prospect lists.


I’d choose a Shopify prospecting market by store fit - not store count. Start with one service, filter stores by country, platform, estimated revenue, and recent changes, analyze tech stacks to identify specific apps, then check each store before outreach.
The October 28, 2026 snapshot lists 2,139,862 live Shopify stores and 2,538,152 WooCommerce stores. The United States has 34.0% of the Shopify total, but missing regional revenue and activity data mean I can’t rank markets by likely client demand.
Here’s how I’d use this regional guide:
- United States and Canada: Filter by revenue and service needs, then check language, currency, and shipping scope.
- United Kingdom and Europe: Add local language, payment, and contact-rule checks.
- Australia and New Zealand: Compare the share of stores that qualify, not just list size.
- India and South Asia: Assess countries separately and keep live counts apart from total counts.
- Latin America: Check local payments, language, and the basis for revenue estimates.
- Southeast Asia and other covered markets: Treat counts as a starting point where data is incomplete.
Revenue estimates aren’t budgets. Technology changes aren’t buying intent. I’d test two country-specific lists under the same outreach rules, check legal requirements, and scale based on <u>qualified meetings and won clients</u>.
Store Distribution by Region
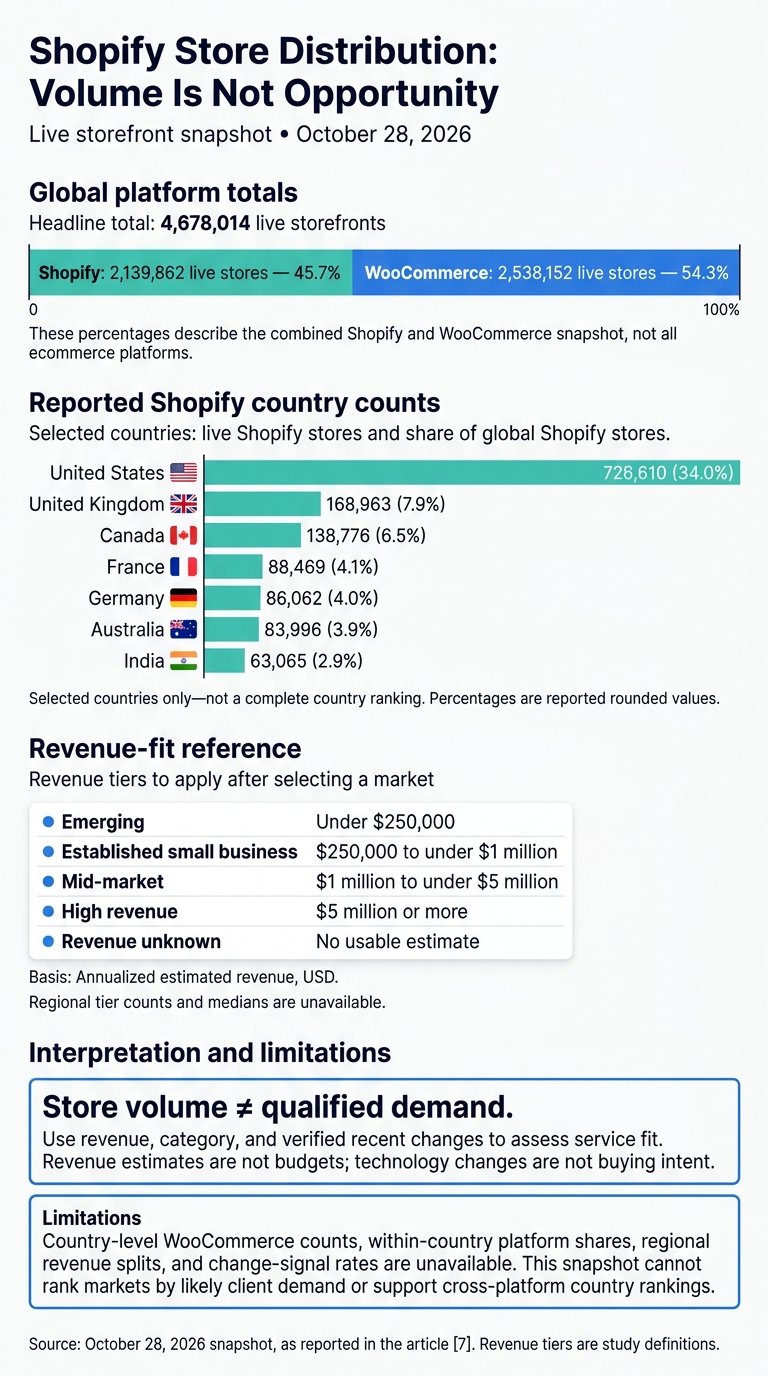
Shopify Store Distribution: Volume Is Not Opportunity
The October 28, 2026 snapshot includes 4,678,014 live storefronts: 2,139,862 Shopify stores and 2,538,152 WooCommerce stores. Shopify makes up 45.7% of the total, while WooCommerce accounts for 54.3%.
Country-level WooCommerce counts, regional revenue splits, and signal rates are unavailable. That means this snapshot cannot support cross-platform market rankings.[6]
Country Store Counts and Platform Mix
Use these counts to plan outreach based on Shopify store volume. The percentages show each country’s share of global Shopify stores - not the platform mix within that country. Dashes mark missing data.
| Region | Country | Shopify stores (% of global Shopify) | WooCommerce stores | Combined stores | Within-country platform shares |
|---|---|---|---|---|---|
| United States and Canada | United States | 726,610 (34.0%) | - | - | - |
| United States and Canada | Canada | 138,776 (6.5%) | - | - | - |
| United Kingdom and Europe | United Kingdom | 168,963 (7.9%) | - | - | - |
| United Kingdom and Europe | France | 88,469 (4.1%) | - | - | - |
| United Kingdom and Europe | Germany | 86,062 (4.0%) | - | - | - |
| Australia and New Zealand | Australia | 83,996 (3.9%) | - | - | - |
| India and South Asia | India | 63,065 (2.9%) | - | - | - |
Source: October 28, 2026 snapshot.
The United States leads the reported Shopify counts, but store volume alone doesn’t tell you where to prospect. These figures show where Shopify stores concentrate. Revenue tiers and category mix help you judge which markets best fit your offer, or you can browse top Shopify stores by revenue and tech stack.
Revenue Tiers by Region and Platform
Regional tier counts, medians, and change-signal rates are unavailable, so markets cannot be ranked by budget fit here. Calculate tier shares using stores with usable revenue estimates, then report the share above your revenue threshold.
| Study tier | Annualized estimated revenue |
|---|---|
| Emerging | Under $250,000 |
| Established small business | $250,000 to under $1 million |
| Mid-market | $1 million to under $5 million |
| High revenue | $5 million or more |
| Revenue unknown | No usable estimate |
Use these tiers in the country-by-country sections that follow to separate markets with more stores from those with more stores that fit your offer.
Category Mix and Recent Store Changes
The supplied category list has no region-level measurements, so it cannot identify regional leaders. It covers Fashion & Apparel, Health & Wellness, B2B/Wholesale, Food & Beverage, Beauty & Personal Care, and Electronics & Gadgets.
For each category, report platform shares and the share of stores above $250,000 in annualized revenue. Compare both with the regional baseline.
Track App Installed, App Uninstalled, Revenue Increased, Revenue Decreased, and Theme Changed separately. A theme change does not imply revenue growth.[8]
In the regional breakdowns that follow, use revenue, category, and change signals together to build targeted Shopify brand prospect lists.
sbb-itb-61169e3
United States and Canada
The October 28, 2026 snapshot lists 726,610 Shopify stores in the United States and 138,776 in Canada [6]. Qualified counts depend on the filters saved with the export and aren’t shown here.
Store counts show where merchants cluster. Revenue and recent changes help you decide who to contact first.
| Country | Shopify stores | Platform segmentation | Revenue fit and recent signals | Outreach rule |
|---|---|---|---|---|
| United States | 726,610 [6] | Keep Shopify and WooCommerce in separate technical lists. | Paid media/CRO: $500,000+ revenue, plus catalog, traffic, theme, product-page, or checkout changes. Email: $250,000+ with repeat-purchase, subscription, or lifecycle signals. Implementation: recent app or theme changes; lower-revenue stores qualify when the technical need is clear. [1] | Check that the store is active, the change is recent and merchant-initiated, and the account has enough internal capacity to justify outreach. |
| Canada | 138,776 [6] | Keep Shopify and WooCommerce in separate technical lists. | Apply the same filters, then verify CAD pricing, bilingual requirements, province fit, and cross-border fulfillment. [1][13] | Target this smaller market when the signal is strong. Confirm operating country, language needs, and domestic or cross-border shipping scope. |
Shopify’s fiscal 2025 disclosures put the U.S. at about 44% of merchants and 63% of revenue, versus about 5% for Canada. [12][13]
For paid media and CRO, keep the higher revenue floor and check for catalog expansion, launches, traffic growth, or recent UX changes. For email and implementation, lower the floor, then verify audience size, consent quality, and the exact technical need.
Keep U.S. campaigns focused by revenue floor, category, and recent change signal. In Canada, also check province, language, and cross-border needs, and quote in CAD for Canada-based outreach. In both countries, prioritize a crawl from the last 7–30 days. Lead with the verified merchant-initiated change - not an estimated sales figure. [1][4]
Apply these same filters to the next region to compare store volume, fit, and signal quality.
United Kingdom and Europe
Use the October 28, 2026 live Shopify counts below as your volume baseline. The revenue and change filters are segments to test - not measured country results.[6] These markets need more localization than North America, so language and contact rules matter as much as store count.
Apply the same revenue and change filters, then tailor outreach to each market’s language, payment expectations, and support norms.
| Country | Live Shopify stores [6] | Revenue and recent-change filter to test | Service fit and country-level checks |
|---|---|---|---|
| United Kingdom | 168,963 | $500,000+; theme or app changes | Shopify implementation; use English, GBP, and UK shipping and returns references. |
| France | 88,469 | $500,000+; theme or localization technology changes | Localization and storefront optimization; use French and EUR. |
| Germany | 86,062 | $500,000+; plugin, theme, or tracking changes | WooCommerce integrations and performance; check for German-language messaging, clear scope, and structured delivery. |
| Netherlands | 50,888 | $500,000+; app or multilingual-stack changes | Cross-border and multilingual work; check storefront language, payments, and support needs rather than assuming English is enough. |
| Spain | 46,713 | $500,000+; platform, plugin, or theme changes | Migrations and technical audits; check local payment, delivery, and support needs. |
| Italy | 44,129 | $500,000+; plugin, theme, or payment changes | Storefront and checkout work; check local payment, delivery, and procurement practices. |
| Ireland | 19,997 | $500,000+; theme or app-stack changes | Implementation and integrations; treat Ireland as a separate market with its own contact rules. |
| Switzerland | 19,215 | $500,000+; theme or integration changes | Multilingual implementation; check working language, payments, and cross-border scope. |
Turn these counts into qualified segments by platform, revenue band, and recent change. Use the study’s USD revenue bands for both platforms.[9] In StoreCensus, export each country-platform segment’s qualified count, qualified-store rate, revenue-band distribution, recent-change rate, and usable decision-maker contacts. Don’t label a country Shopify-heavy without a platform denominator.
Once you’ve selected countries, apply the filters separately to each platform before building your prospect list.
Shopify implementation: Target active stores above $500,000 with a theme or app-stack change in the last 180 days. Then prioritize merchants at $1 million+ in your core categories.
WooCommerce technical work: Use the same revenue floor, with recent plugin or theme changes and at least three detected commerce integrations.
Only use integration filters where detection supports them. Check complexity manually through subscriptions, multilingual functionality, or catalog size. An app removal signals change - not dissatisfaction. A tool that wasn’t detected may still be in use.
Contact data does not authorize outreach. Before adding prospects to campaigns, distinguish UK corporate subscribers from sole traders and certain partnerships. PECR generally treats these groups differently for marketing email.[14][15] For EU prospects, check national channel rules, record the source and lawful basis for personal contact data, and maintain sender identification and opt-out handling. Apply Swiss rules separately. These are prospecting safeguards, not blanket legal clearance.
Australia and New Zealand
Australia and New Zealand are smaller markets than North America and Europe, which are dominated by the Shopify stores list in the USA, so qualified rate matters more than raw volume.
Australia has 83,996 live Shopify stores in the October 28, 2026 snapshot.[6] New Zealand has 23,004, though its snapshot date is not established.[3] These are volume baselines - not qualified prospect counts. Test the concentration of qualified stores rather than ranking markets by size.
Use the table to compare volume, then filter by revenue and change signals before building outreach.
| Comparison | Australia | New Zealand |
|---|---|---|
| Live Shopify stores | 83,996; October 28, 2026[6] | 23,004; snapshot date not established[3] |
| Service fit to test | Paid acquisition, SEO, CRO, lifecycle marketing, and international expansion | SEO/search, conversion work, category merchandising, retention, and Australia expansion |
| Main prospecting risk | Larger lists can hide low-fit stores; multiple time zones | Smaller segments can exhaust the pool quickly |
Before ranking either market, get qualified counts and rates, platform shares, revenue-tier distributions, and recent-change rates from StoreCensus.
For a direct comparison, define qualified as an active Shopify or WooCommerce store in your target category that exceeds your revenue threshold and has at least one growth or change signal from the last 90 days. Export both countries on the same date to decide which belongs in a campaign segment.
Report counts and percentages by platform and revenue tier, along with qualified stores divided by all detected stores. Measure signal availability separately. Otherwise, a missing signal can look like inactivity when it’s simply a detection gap.
Test category fit in StoreCensus, then compare mid-market stores with and without recent change signals. Keep the signal filter only if the qualified list stays large enough and meeting rates improve. Revenue is not budget.
After qualification, US-based teams can use asynchronous audits and book Australian meetings in the late afternoon or evening Eastern Time, adjusting for daylight saving time.[16] Segment Australia by state or time zone and schedule New Zealand separately. Judge both markets by qualified opportunities per hour, not replies.
Use the same qualification logic in India and South Asia, where scale and fit diverge even more sharply.
India and South Asia
This segment covers India, Pakistan, Bangladesh, Sri Lanka, and Nepal. Use India as the anchor market, and compare smaller countries separately. Include Bhutan and the Maldives only when indexed-store volume is large enough to support a comparison.
Live Shopify counts reflect the October 28, 2026 snapshot.[6] Total Shopify counts come from StoreCensus.[3] WooCommerce, qualified-store, revenue, and recent-change data are unavailable for this segment.
Apply the same revenue-and-change filters here, but assess smaller countries by qualified rate rather than store volume.
| Country | Store volume | Service fit to test | Sample status and risks |
|---|---|---|---|
| India | 63,065 live Shopify[6] (153,298 total Shopify[3]) | WooCommerce technical work and Shopify optimization | High-volume market; do not average it with smaller countries |
| Pakistan | 24,560 live Shopify[6] (48,723 total Shopify[3]) | Checkout, performance, retention, and technical work | Total and live counts are not interchangeable |
| Bangladesh | 18,488 total Shopify[3] | Test payment integration and mobile conversion | Directional only; coverage gaps can skew comparisons |
| Sri Lanka | 4,825 total Shopify[3] | Test theme, catalog, and tracking work | Small sample; flag unstable percentages |
| Nepal | 1,517 total Shopify[3] | Test checkout and technical maintenance | Small sample; flag unstable percentages |
Account for coverage limits by separating platform-specific filters before comparing countries.
For WooCommerce, combine country, category, revenue band, detected plugins or payment tools, and recent technology changes. Check mobile performance, checkout, and integrations before outreach.[4][5]
For Shopify, combine country, category, revenue estimates, and theme or app changes. Review navigation, product information, and mobile buying flows before outreach.[5]
Before ranking countries for outreach, export both platforms on the same date. Report revenue coverage by count and share, label the currency and time basis, and keep missing estimates separate from low revenue. Report recent changes for both total and qualified stores, flag small samples, and check shipping scope before pitching international work.[1]
Use the same filter logic in the next regional block, where coverage gaps make qualification even more important.
Latin America
Apply the same qualification filters in Latin America, but pay extra attention to local payments and language. Prioritize Brazil, Mexico, Colombia, Chile, and Argentina. Treat Peru as secondary and the other covered markets as smaller segments. Use Portuguese for Brazil and Spanish for the rest.
Store count is just a starting point. Local payment support and comparable revenue figures help determine which stores to prospect. The offers below are hypotheses to test - not measured demand.
| Country | Language | Shopify stores | Best-fit offer | Key checks |
|---|---|---|---|---|
| Brazil | Portuguese | 60,120 total; live not reported[3] | Portuguese UX, CRO, platform implementation, and checkout localization | Tax, payments, fulfillment, and language |
| Mexico | Spanish | 45,382 total; 25,434 live[3][6] | Spanish localization, CRO, payment integration, and cross-border optimization | Currency, customs, OXXO/SPEI availability, and cross-border scope |
| Colombia | Spanish | 67,073 total; 41,009 live[3][6] | Spanish CRO, mobile UX, platform development, and local payments | Logistics, payment coverage, and regional delivery |
| Chile | Spanish | 25,849 total; live not reported[3] | Premium design, CRO, theme work, analytics, and international storefront support | Market size, shipping economics, and customer location |
| Argentina | Spanish | 21,634 total; live not reported[3] | CRO, localization, retention, and technical maintenance | Inflation, currency volatility, import restrictions, and revenue comparability |
| Peru | Spanish | 15,921 total; live not reported[3] | Localization, CRO, and platform-specific development | Currency, shipping, and fulfillment |
Other covered markets: Ecuador (5,645), Costa Rica (4,038), Uruguay (3,681), Guatemala (3,220), the Dominican Republic (2,715), Venezuela (2,669), Panama (2,633), and Paraguay (1,380).[3] These smaller segments can support campaigns when qualification rates justify them.
Use the table to size your initial list, then build a prospecting pipeline to qualify accounts before outreach. StoreCensus filters can fill gaps in revenue, category, and activity data. For localization work, prioritize Country, Language, Active Theme, and Industry Vertical. For technical work, separate Shopify from WooCommerce first. Then check apps, plugins, theme changes, and checkout compatibility with local payment methods.[4][5][1]
Payment localization drives conversion. Brazil often needs Pix, boleto, and installments; Mexico often needs OXXO and SPEI; Colombia often needs PSE and local wallets.[17][18]
Confirm each merchant’s preferred language, checkout currency, shipping scope, and focus on domestic or cross-border sales. Before comparing revenue estimates, verify the currency and conversion basis - especially in Argentina. Check the actual checkout before pitching a missing payment method. Technology detection alone cannot tell you what customers can use.[4]
Southeast Asia and Other Covered Markets
Southeast Asia includes the countries in the table below, plus Brunei Darussalam, Laos, Myanmar, and Timor-Leste.[3] This part of the study has the least complete coverage. Use it to guide initial screening, not to rank markets.
These figures are snapshot store counts, not market totals.[3] Qualified counts, platform shares, revenue coverage, and change-signal rates aren't available. The service-fit labels are ideas to test, not confirmed opportunities. Start with store counts, then apply revenue and change filters to find qualified prospects.
| Country | Store count | Service fit to test | Main risk |
|---|---|---|---|
| Vietnam | 27,767 | Early-stage acquisition and storefront modernization | Unverified traction and limited high-revenue samples |
| Indonesia | 24,928 | Localization, performance marketing, and marketplace-to-DTC work | Language, payment, and logistics complexity |
| Singapore | 23,055 | Premium brand growth, CRO, and retention | Small domestic market; regional HQs can skew country attribution |
| Malaysia | 18,751 | Bilingual regional campaigns and store optimization | Cross-border sellers may be classified inconsistently |
| Philippines | 10,461 | English-language ad content, CRO, and lifecycle services | Revenue and launch dates may be incomplete |
| Thailand | 8,554 | Localization and mobile commerce | Thai-language outreach and payment variation |
| Cambodia | 1,115 | Selective testing where qualified records exist | Small samples, unclear launch dates, or weak signal coverage |
Other covered markets include China, Japan, South Korea, Taiwan, and Macao in East Asia; Turkey, Israel, Saudi Arabia, the United Arab Emirates, Kuwait, and Qatar in the Middle East grouping; and South Africa, Egypt, and Nigeria in Africa.[3]
No usable figures in this snapshot: Brunei Darussalam, Laos, Myanmar, and Timor-Leste. Their status is unconfirmed. Missing figures don't mean zero stores or prove that these countries fall outside coverage. Palau, Sint Maarten, and North Korea are described as samples below 50 stores - not uncovered markets.[3]
Apply the same country, platform, revenue, category, and change filters here, then check each storefront before outreach.[7][10] Check “Last Crawled” and “Website Created At,” but don't treat either as proof of a launch date.[5][10]
Choose Markets and Build StoreCensus Segments
After comparing regions, turn the strongest markets into ranked outreach segments for a specific offer.
Score Markets by Service Fit
Score each market for one offer - not for your agency’s services as a whole. Combine the regional filters into a single score:
Opportunity = 0.35V + 0.25R + 0.20S + 0.20P
Here’s what each component measures:
- V: Store volume after platform, category, and service-fit filters, but before revenue filtering.
- R: Share of stores in your target revenue tier.
- S: Share with a recent change signal, calculated only among records with signal coverage.
- P: Platform-fit score.
Normalize each component to 0–100 and use the same signal window across markets. These weights and rules are hypothetical, not validated sales predictions.
Show the revenue-qualified store count beside each score. Label unavailable components missing, not zero, and leave markets with missing data unranked.
Agency offer Market to test Platform Revenue tier Timing signal Main risk Shopify CRO agency United States Shopify Mid-market and above Recent redesign or technology change High competition and expensive outreach Shopify internationalization agency United Kingdom or Australia Shopify Growth-stage stores Recent catalog, traffic, or app change Smaller addressable pool and time-zone coverage WordPress technical agency Germany or Canada WooCommerce Established merchants Recent plugin, theme, or hosting change Platform-specific technical requirements
Build country-specific segments from the highest-scoring markets, then test them using one controlled outreach setup.
Build and Test Country-Specific Outreach
In StoreCensus, combine country, platform, estimated revenue, category, and a change signal. Build separate WooCommerce segments only for services your team can deliver, such as WordPress development, plugin integration, performance, or migration.
Review each store’s stack and theme, confirm a specific service gap, and validate decision-maker contacts before saving or exporting qualified records. Name each segment by platform, country, category, revenue tier, and signal window. Deduplicate records against your CRM and check for changes weekly.
Before sending, lock in the qualification rules. Keep the offer, sender, channel, follow-up count, and observation window the same. Use one contact per store and count each contact once - not each follow-up. The table below is a measurement template, not campaign evidence.
| Funnel measure | Counting rule | Reporting denominator |
|---|---|---|
| Qualified contacts | Relevant decision-makers at stores meeting all segment and service-fit rules | Count selected before sending |
| Delivered outreach | Contacts whose mail server accepted at least one message, counted once each | Qualified contacts |
| Qualified replies | Contacts confirming a relevant need, counted once each; exclude autoresponders | Delivered outreach |
| Booked meetings | Contacts with an accepted meeting during the observation window, counted once each | Delivered outreach |
Qualification does not replace compliance.
Contact availability is not permission to market. Check the rules in each jurisdiction before outreach. U.S. CAN-SPAM requires accurate sender details, a physical postal address, and an opt-out.[19] Canada’s CASL generally requires consent or valid implied consent, sender identification, and an unsubscribe mechanism.[20] UK PECR and data-protection rules differ for corporate and individual contacts.[14][15]
Document the legal basis, contact source, retention period, and suppression status. Measure segment results by qualified meetings and eventual revenue - not replies alone.
Conclusion: Prioritize Qualified Stores Over Volume
After comparing regions, focus less on where the most stores are and more on which stores fit your offer. The largest store pool isn’t automatically the best prospecting market. Shopify is strongest in the United States and Europe, while WooCommerce leads many country-level data sets. The United States also accounts for a larger share of Shopify revenue than its share of merchants.[11][21][12]
Platform and timing help narrow your list. Shopify theme and app work targets a different pool than WooCommerce hosting and plugin integration. Recent tech or catalog changes can help you decide whom to contact first, but they don’t prove buying intent.
Build one StoreCensus segment and test it against another market. Keep the qualification rules and test setup the same. Scale only after the segment shows it can produce qualified meetings and won clients.
FAQs
How can I validate a store’s estimated revenue?
Treat estimated revenue as a fit signal, not a fact. Estimates rely on indirect signals and are typically 30–50% accurate [1][2]. Use revenue bands to group accounts by complexity and service tier [1].
Test your scoring model against a revenue-only baseline using held-out accounts. Track qualified replies and opportunities to see whether higher-scoring leads convert better. Treat missing values as unknown, and review conflicting data manually [1].
How many prospects do I need to test a region?
There’s no fixed number. Check whether a region can support your outreach volume, timing, and local demand. Start with country and language as pass-fail filters to confirm you can serve the accounts.
Next, assess regional density and market maturity - for example, the share of Shopify Plus stores - to judge how efficiently you can build lists and how much outreach the market can support. Denser markets typically return more qualified merchants in a single search.
How should I compare markets with incomplete data?
Use revenue and traffic estimates to spot trends, not measure exact performance. They aren’t audited financial disclosures [1][2]. Treat country and language as pass-fail checks for whether you can serve a prospect, and manually review conflicting location data [3].
If enterprise status or another tier value is missing, mark it as unknown - not negative. Keep that uncertainty visible in your CRM. Validate against a held-out baseline, and give actual sales results more weight than theoretical scores [3].