UGC Conversion Rates: Data From 2026
UGC increases conversions most on product pages—photo/video reviews, galleries, and native ads drive the biggest measurable lifts.

If you want the short answer: UGC still helps stores convert in 2026, but it works best on product pages and when shoppers interact with it.
From what I see in the data, the biggest gains come from three places:
- Reviews and ratings on PDPs
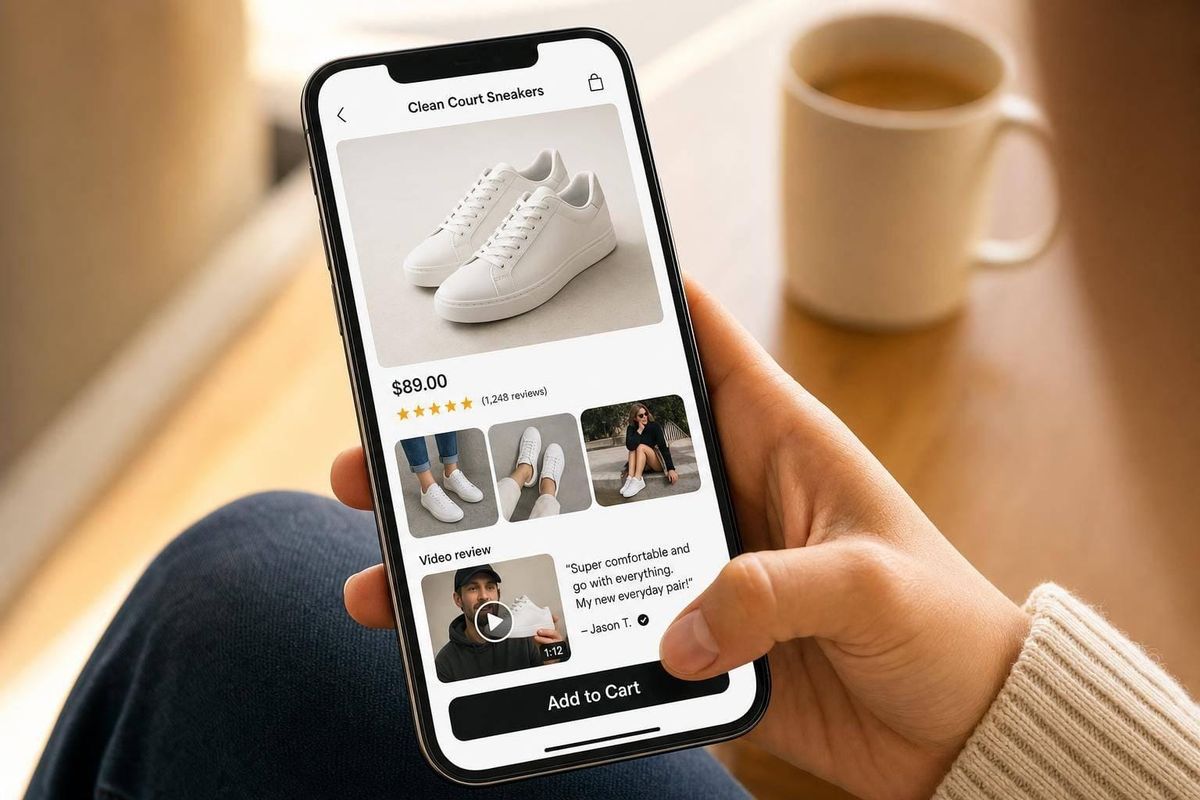
- Photo and video UGC near the buy button
- UGC-style ads and creator posts in paid social
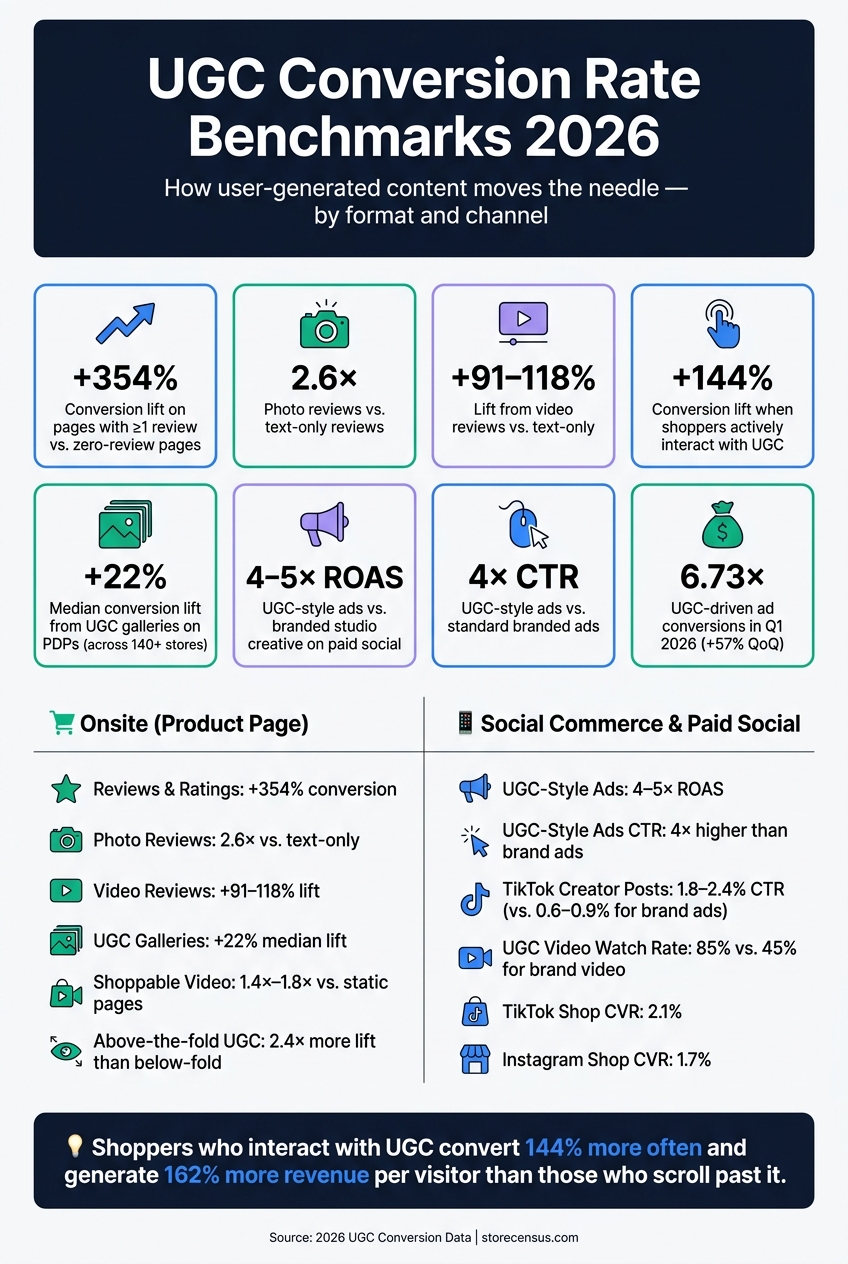
A few numbers stand out fast:
- Pages with at least 1 review convert 354% higher than pages with none
- Photo reviews convert 2.6x better than text-only reviews
- Shoppers who interact with UGC convert 144% more often
- UGC galleries on PDPs show a +22% median lift
- UGC-style ads can drive 4x higher CTR and 4–5x ROAS
Here’s the plain takeaway: UGC has the most impact when buyers are close to a decision. Onsite, it helps answer purchase questions. On social, it helps stop the scroll and drive clicks.
| Format | Where it works best | What the data points to |
|---|---|---|
| Reviews and ratings | Product pages | Higher conversion near purchase |
| Photo and video UGC | Product pages | More lift than text-only proof |
| UGC galleries | Product pages | Median conversion gains across stores by apps used |
| Creator posts | Social commerce | Better feed performance and in-platform sales |
| UGC-style ads | Paid social | Higher CTR and stronger ROAS than brand ads |
If I had to boil the full article down to one line, it would be this: put UGC where buyers hesitate, and make it easy for them to click, watch, filter, and compare.
UGC Conversion Rate Benchmarks 2026: Key Stats by Format
Increase Conversion Rate By Adding Social Media & UGC In Your Store
sbb-itb-61169e3
2026 UGC conversion benchmarks by format
Format matters. Placement matters too. A review on a product page does a different job than a creator post inside social commerce.
The next step is figuring out where each format tends to move the needle most: on the product page or inside social.
Product-page reviews, ratings, Q&A, and visual UGC
Reviews have an immediate effect. Product pages with at least one review convert at a 354% higher rate and generate 446% more revenue per visitor than pages with no reviews.
That’s the baseline. From there, the type of UGC starts to shape results in a bigger way.
Photo reviews convert 2.6× better than text-only reviews. Video pushes things even further: shoppers who watch a video review convert 91–118% more often than shoppers who only read text.
Brand examples point in the same direction. G-Star RAW saw an 18% lift in product page conversions after adding UGC galleries to its site. Skincare brand goPure reported an average 13% conversion rate from visitors who engaged with UGC video, with peaks hitting 26%.
That’s the big takeaway here: visual UGC tends to work best right at the buying moment, when a shopper is already close to making a choice.
Onsite numbers are usually the strongest. Social commerce, though, uses a different yardstick.
UGC social posts, creator content, and UGC-style ads
On social, performance is measured a bit differently. Instead of just looking at product-page conversion lift, teams often focus on CTR, ROAS, or in-platform conversion rate.
Even with that shift, the gap can still be big. UGC-style ads generate 4× higher click-through rates than standard branded ads. And UGC creative averages 4–5× ROAS compared with branded creative on the same paid social spend.
| UGC Format | Channel | Reported Lift | Measurement Note |
|---|---|---|---|
| Star Ratings / Reviews | Onsite PDP | +354% conversion | Pages with ≥1 review vs. zero-review pages |
| Photo Reviews | Onsite PDP | 2.6× vs. text-only | Lift compared to text-only reviews |
| Video Reviews | Onsite PDP | +91–118% | Lift among viewers vs. non-viewers |
| UGC Galleries | Onsite PDP | +22% median | Median across 140+ stores |
| Shoppable Video | Onsite PDP | 1.4×–1.8× | vs. static product pages |
| UGC-Style Ads | Paid Social | 4–5× ROAS | vs. branded studio creative |
| Creator Posts | TikTok Shop | 2.1% CVR | Absolute rate, not lift |
| Creator Posts | Instagram Shop | 1.7% CVR | Absolute rate, not lift |
The pattern is pretty clear. Onsite UGC shows the sharpest lift near purchase, while social and creator formats are more often tracked through platform metrics like conversion rate, CTR, or ROAS. That measurement gap matters when you compare channels side by side.
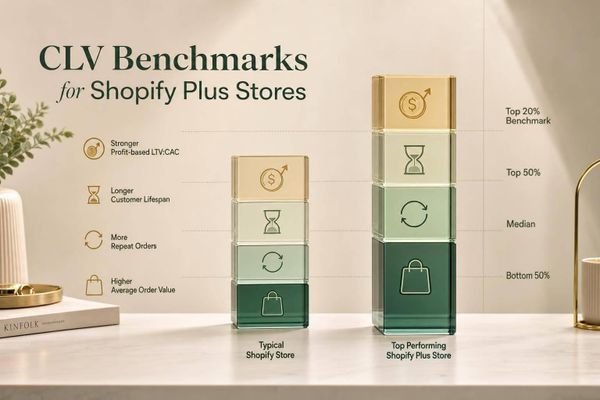
Where UGC lifts conversion most: product pages vs. social commerce
UGC tends to move conversion the most in two places: product-page evaluation and social-feed discovery. The big difference isn’t the asset on its own. It’s when the shopper sees it, and what they’re trying to do in that moment.
| Channel | UGC Format | Shopper Intent | Where Lift Is Strongest |
|---|---|---|---|
| Product Page (Onsite) | Reviews, ratings, Q&A, shoppable video | High (evaluation/purchase) | Reduces hesitation right before "Add to Cart" |
| Social Commerce | Creator posts, native video, UGC-style ads | Low to mid (discovery/browsing) | Drives clicks and purchases through a native, authentic feel |
On product pages, shoppers already know what they’re looking at. They’re trying to answer very practical questions: Does this fit true to size? How does it hold up after a few months? Does the color look different in person? UGC helps answer those questions with proof from other buyers. That’s why the lift is often strongest at the PDP level.
On social, people are usually earlier in the journey. They’re browsing, half-curious, and easy to lose.
Onsite UGC: why interaction matters more than exposure
Onsite, UGC works best when it helps shoppers make a decision.
Just placing reviews on a page isn’t the whole game. There’s a clear gap between shoppers who merely see UGC and shoppers who actually use it, like clicking a photo, filtering reviews by size or skin type, or opening a video.
That difference shows up fast in the numbers:
- Shoppers who actively interact with UGC convert 144% more often and generate 162% higher revenue per visitor than those who just scroll past it.
- Visitors who click on photo or video UGC convert 103.9% more often than non-interactors.
That’s why filterable UGC widgets tend to beat static review blocks. They shift the shopper from passive viewing to active evaluation.
Social commerce UGC: why native content wins near the buying moment
In social commerce, the same kind of proof works earlier in the funnel, when the main hurdle is attention.
Native creator content performs well because it blends into the feed instead of looking like a hard-sell ad. On TikTok, short-form creator content sees CTRs of 1.8–2.4%, compared with 0.6–0.9% for brand-produced ads on the same platform. Shoppers also watch 85% of a UGC video versus 45% of a brand-produced video, which means more of the message actually lands. And when that content is shoppable, it pulls people much closer to purchase.
What the 2026 data means for Shopify and WooCommerce teams

Put proven UGC formats at the highest-friction points first
The 2026 benchmarks point to a simple playbook: fix friction closest to purchase first.
Start with the spots buyers see before they do anything else. Above-the-fold UGC lifts conversion 2.4x more than the same content placed below the fold. That makes ratings and galleries the first things to move up the page.
Review count matters too. Product pages with fewer than 20 reviews per SKU see little conversion impact. So if a SKU is sitting below that line, focus on getting more reviews in first. Tuning layout, design, or placement can wait until the page has enough proof to matter.
When shoppers are stuck on sizing, fit, or shipping, some UGC formats do more work than others. Customer Q&A and video reviews help most at those decision points. Video reviews convert 4.1x better than text-only reviews, and photo reviews convert 2.6x better. There’s also a clear format winner inside video itself: unboxing and first-impression videos convert 22% better than standard talking-head formats.
Use UGC-backed creative in paid social and creator workflows
That same pattern shows up in paid social. Ads that look native tend to lower resistance, and the onsite data backs that up. If you’re running paid social, test UGC-style creative right next to the brand assets already in rotation instead of treating it like a separate lane.
The numbers are hard to brush off. UGC-driven conversions for ads hit 6.73x in Q1 2026, up 57% quarter over quarter.
Some categories stand out more than others:
- Beauty and cosmetics lead at 45%–65%
- Skincare, athleisure, and home goods come next
If you manage paid social for brands in those spaces and you’re still not testing UGC-style creative, you’re leaving a pretty big gap untouched.
Use merchant data to find the right prospects to pitch
This data doesn’t just help with execution. It also helps agencies figure out who to pitch.
The best prospects are usually easy to spot: merchants with strong traffic but thin review volume, stores in high-impact categories like beauty or fashion, and brands using shoppable galleries without structured review markup or above-the-fold placement.
StoreCensus helps agencies find Shopify brand prospect lists with high traffic, thin reviews, or missing review and video widgets. That 20-reviews-per-SKU threshold gives you a clean, concrete angle for cold outreach.
Conclusion: UGC is still a measurable conversion lever in 2026
The 2026 results land on one clear point: UGC tends to lift conversion most when it appears close to the buying decision and shoppers actually engage with it. Placement and format still affect how much lift brands see, but the pattern stays the same across categories.
The big shift in measurement is the focus on attributed revenue. 76% of brands now report UGC-attributed revenue, which makes the business impact much easier to show. What changed in 2026 isn’t whether UGC works. It’s where it works best and how brands track it.
In 2026, UGC is still a measurable conversion lever. The strongest results come from high-intent placements, native social creative, and formats that invite interaction.
FAQs
How many reviews does a product page need to lift conversion?
If a product has zero reviews, getting the first review can make the biggest difference for conversion.
The largest jump usually comes early. Moving from 0 to 10 reviews can lift conversion rates by about 53% to 95%.
After roughly 30 reviews, the lift starts to level out. At that stage, it makes more sense to focus less on total review count and more on review quality and how reviews are shown on the page.
What kind of UGC should I add first on product pages?
Start with a UGC gallery on product pages and place it above the fold. That first spot tends to work best because shoppers see it right away.
A smart starting mix is 30% customer photos and videos and 70% studio content. Then track performance for 60 days and see how people respond.
When you review results, put more weight on authentic demos and result-focused videos than polished visuals. In plain English: people usually want to see how the product looks, works, and fits into everyday life - not just how pretty the edit is.
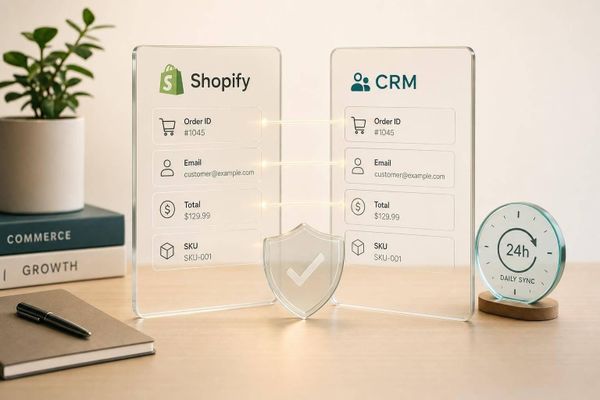
How should I measure UGC performance on-site vs. social?
Use different measures for social and on-site PDPs because attribution and user intent aren't the same.
On social, focus on Hook Rate and Hold Rate as early signals:
- Hook Rate = 3-second view-through
- Hold Rate = average watch time
These numbers tell you if the content stops the scroll and keeps people watching. That matters on social, where attention is short and purchase intent is often weaker at the start.
On-site, take a different approach. Run an A/B test with a control group and a UGC-enabled variant. Make PDP order conversion the main metric, and use AOV and dwell time as supporting metrics.
For social commerce attribution gaps, lean on page-level conversion for forecasting. Then use engager-only metrics to back a stronger UGC presence on the page.