5 Demographic Signals for Qualifying Ecommerce Leads
Qualify ecommerce leads with five demographic signals—age, location, revenue, company size, and tech stack—to prioritize sales-ready accounts.


Most bad ecommerce leads fail on fit, not timing. If I want better outreach, I should screen for five things first: decision-maker age group, location, revenue band, company size/buyer role, and tech stack.
Here’s the short version:
- Revenue is the first budget check. Stores under $250,000 are often a weak match for large retainers, while $250,000 to $1 million is often the sweet spot.
- Location helps me spot markets with more spend and more stores in one place.
- Company size tells me who can say yes and how long the deal may take.
- Age group helps me judge buying style and who is most likely to reply.
- Tech stack shows how mature a store is. Apps like Klaviyo, ReCharge, and Triple Whale often point to a store that already spends on growth.
A simple scoring model can make this easier. I can first remove hard misses like stores outside Shopify or WooCommerce, no verified contact info, very new stores, or clear dropshipping signs. Then I can score the rest across those five signals and sort them into hot, warm, or cold.
The payoff is simple: qualified lists can hit 8% response rates, while mass outreach often stays below 1%. So if I want fewer wasted calls and more sales-ready accounts, these five signals should come before I send a single email.
Quick Comparison
| Signal | What I learn fast | What it helps me decide |
|---|---|---|
| Decision-maker age group | Buying style and likely contact type | Tone, contact choice, reply odds |
| Location | Market spend and store density | Where to focus outreach |
| Revenue band | Budget range | Whether the store can afford my offer |
| Company size / buyer role | Approval path | Who signs off and deal length |
| Tech stack / theme | Store maturity | Whether the account fits my service |
That’s the core idea: filter for fit first, then score what’s left using our Shopify store guides.
sbb-itb-61169e3
Why Demographic Fit Makes Ecommerce Lead Scoring More Accurate
Demographic fit answers the first question: is this merchant a match for your offer? That makes lead scoring more precise before any engagement data shows up.
This kind of data sharpens lead scoring in three areas: budget prediction, project complexity, and the odds of closing. A store’s revenue band gives you a quick read on whether they can afford a retainer. Its tech stack shows how advanced the operation is. And two or three verified decision-makers - like a founder and CMO - beat a generic info@ inbox.
The idea is simple: use merchant, company, and proxy data together. You want to know who the decision-maker is, what the business can spend, and what the storefront says about how mature the brand is. Proxy signals are often the fastest to pull, and they can give you the most current read on buying readiness. If a store is running Triple Whale, Klaviyo, and a paid Shopify theme, that usually points to a more advanced setup before you ever send a message.
| Signal Type | Examples | What It Helps Predict |
|---|---|---|
| Merchant Demographics | Age group, role, decision-making authority | Outreach tone, who to contact |
| Company Demographics | Revenue band, employee count, location | Budget capacity, organizational complexity |
| Proxy Signals | Traffic tier, tech stack, ad pixels | Growth stage, sophistication, readiness to buy |
If your team needs to filter leads faster, a search tool can handle a lot of this up front. StoreCensus lets you search 6M+ Shopify and WooCommerce stores by revenue, tech stack, theme, country, growth signals, and decision-maker contacts. That means you can build better-qualified lists before you find and target Shopify stores for outreach.
1. Decision-Maker Age Group
Decision-maker age can tell you a lot up front: how comfortable someone is with budget approvals, how fast they reply, and how open they are to new tools.
Budget Fit and Operational Serviceability
For agency outreach, the 25–54 age group is often the best fit. Buyers in that range are more likely to approve discretionary spend. In plain English, they’re often in the sweet spot: experienced enough to control budget, but still comfortable with modern ecommerce systems.
Age also affects how easy an account is to service. Buyers in this group usually already work with ecommerce tools and reporting stacks, which makes onboarding and day-to-day communication much smoother.
There’s also a pattern in how different age groups make decisions. Younger operators often try tools faster. Older decision-makers usually want proof first, along with a clearer ROI before they move ahead.
Decision-Maker Accessibility
Founder-led brands are usually easier to reach and tend to close faster. Bigger brands often add more layers, which means you may need to go through a CMO or Head of Growth instead.
So age helps you narrow down who to contact. Location helps you judge where it’s easiest to sell and where merchant density is strongest. From there, the next step is to check whether the merchant’s region can support your outreach volume, timing, and local demand.
2. Merchant Location and Regional Density
If age helps you figure out who makes the call, location helps you spot where the best-fit accounts are. It’s one of the fastest ways to gauge budget before you even look at revenue.
Budget Fit
Geography ties closely to spending power. The median U.S. Shopify store brings in about $120,000 per year, but that figure changes a lot by market. Major metro areas come in well above that mark, while secondary markets like smaller Midwestern cities tend to land around $60,000 to $80,000.
That’s why it makes sense to start with major U.S. metros if you sell higher-ticket services, then move outward from there.
Operational Serviceability
Country and language should work as simple pass-fail filters. If you can’t serve the account well, cut it from the list.
After that, look at whether the market itself justifies the spend. A lead might match your niche on paper, but if the region doesn’t support strong budgets, the fit can fall apart fast.
Market Maturity
The regional share of Shopify Plus stores can tell you a lot about how advanced a market is and how much prospecting volume it can support. Australia leads the world with 27.1% Shopify Plus adoption, which makes it a strong target for high-value services. The U.S. sits at 18.1%, and Japan comes in at 8.1%.
Denser markets usually mean more qualified merchants show up in a single search. That makes list building faster and outreach less of a grind.
Once location narrows the market, the next filter is revenue band, which shows whether the lead can pay for your offer.
3. Store Revenue Band
Once location trims the market, revenue band tells you something more useful: can this store afford your offer, what kind of help does it need, and who will approve the spend?
Budget Fit
A monthly retainer often falls around 0.5%–1% of annual revenue.
| Revenue Tier | Fit for Agency Retainers | Suggested Monthly Retainer |
|---|---|---|
| $50K–$250K | Low-fit only | Usually pass |
| $250K–$1M | Medium | $3K–$5K |
| $1M–$5M | High | $5K–$10K |
| $5M+ | Very High | $10K–$20K |
That budget range shapes the rest of your qualification bar. It affects the service level you can pitch, the amount of complexity the account can handle, and the odds that the deal will close.
Service Complexity
Budget tells you what a merchant can pay. Revenue tier tells you what kind of help they’re likely to need.
Growth-stage stores ($500K–$2M) are still putting the core pieces in place - email flows, early paid ad setups, and baseline retention work. Scaling stores ($2M–$10M) usually need tighter optimization and better coordination across channels. Established stores ($10M+) tend to care more about attribution modeling, international expansion, and enterprise-level infrastructure.
If the offer doesn’t match the tier, deals tend to die fast. A small store won’t buy a big, heavy service package. A larger brand won’t want a basic setup it could have outgrown a year ago.
Stack Sophistication
Higher revenue often means a more complex tech stack, but not always. And that gap can turn into an easy agency win.
A store might be making good money while still running on a messy setup, weak integrations, or underused tools. That’s why revenue is useful: it helps narrow the offer before you spend time on deeper qualification.
Revenue narrows the offer. The next filter is who owns the account.
4. Company Size and Buyer Role
Revenue shows whether a store can afford your service. Company size answers a different question: who can approve the spend and how long the deal may drag on.
Budget Fit
Company size shapes the approval path. In smaller stores, the founder often makes the call. In mid-market companies, that job usually sits with marketing leadership. In enterprise accounts, procurement often enters the picture.
Service Fit
Larger teams can usually handle more involved services. Founder-led stores tend to move faster, but they often need a simpler way of working together.
Buying Sophistication
Shopify Plus status often points to heavier spend on infrastructure and growth.
Decision-Maker by Size
| Segment | Revenue Tier | Decision-Maker | Sales Cycle |
|---|---|---|---|
| Growth-Stage | $500K–$2M | Founder / Marketing Manager | 1–2 weeks |
| Scaling | $2M–$10M | CMO / Head of Growth | 2–4 weeks |
| Established | $10M+ | VP Marketing / C-suite | 4–8+ weeks |
If you're using traffic as a stand-in for size, there's a sweet spot: 10K–50K monthly visitors. These stores are often big enough to have a real budget, yet still small enough that the founder may still be checking their own inbox.
For mid-market stores, reaching out to 2–3 contacts per account can improve your shot at a reply. And the gap in results is hard to ignore: highly qualified, size-matched lists can hit 8% response rates, while unqualified mass outreach often lands at less than 1%.
Company size helps you figure out three things fast:
- who can buy
- who can approve
- how long the deal may take
Next, look at the platform and stack to see if the merchant is advanced enough for your offer.
5. Platform, Tech Stack, and Theme Sophistication
After revenue and company size, the stack tells you how mature an account actually is.
Platform choice, app stack, and theme quality can say a lot about budget, maturity, and the kind of help a store may need. You can often spot this in a few minutes.
Budget Fit
Tools like Klaviyo, ReCharge, Triple Whale, and Yotpo usually point to a store that spends on growth, not a bare-bones setup. A paid or custom theme adds to that picture. In fact, 72.5% of the highest-scoring Shopify leads (95–100) use a paid or custom theme.
That’s why a high-traffic store still running the default Dawn theme stands out. It often signals a clear optimization gap.
Operational Serviceability
Some stack combinations make the opportunity pretty obvious.
A store using Triple Whale for attribution but no email marketing app is a clear lifecycle opening. Same story with a high-traffic store on a free theme when the rest of the business looks mature. The brand may have demand and spend, but the on-site experience hasn’t kept up.
Ad and Data Maturity
If a store is running Meta, TikTok, Google Ads, and Klaviyo tracking, it’s actively investing in paid acquisition across multiple channels.
At the same time, only 10.2% of the highest-scoring stores have a visible third-party analytics app installed. That leaves a clear opening for agencies focused on data, measurement, and attribution.
Decision-Maker Accessibility
These signals also help you send the pitch to the right person instead of guessing.
| Tech Signal | What It Reveals | Best Contact |
|---|---|---|
| Klaviyo / Omnisend | Invests in marketing automation | CMO / Head of Marketing |
| ReCharge / Skio | Recurring revenue model; serious business | Founder / CEO |
| Triple Whale / Northbeam | Data-driven; tracks ROI carefully | CMO / Head of Growth |
| Custom or Paid Theme | Invested in brand experience | Founder / CTO |
| Shopify Plus Status | High budget; operational complexity | VP of Marketing / Ecommerce Lead |
These tech signals make revenue-tier qualification faster.
You can also use them to build filtered prospect lists with less guesswork. StoreCensus lets you search 6M+ Shopify and WooCommerce stores by revenue, tech stack, theme, country, and growth signals, then surface decision-maker contact information so you can build outbound lists that already match your agency's service profile.
Revenue Tiers and Agency Fit at a Glance
Revenue is the fastest way to gauge how mature a store is, what kind of budget it may have, and how well your offer lines up.
| Revenue Band (USD) | Typical Monthly Range | Team Maturity | Tech Stack Complexity | Probable Service Needs |
|---|---|---|---|---|
| Under $250,000 | Low ($2k–$3k) | Founder-led; DIY operations | Basic: free theme (e.g., Dawn), 1–2 apps, minimal tracking | Store setup, basic audits, starter email flows |
| $250,000–$1 million | Medium ($3k–$5k) | Founder-led; small team forming | Intermediate: paid theme, 3–5 apps, Meta/TikTok pixels active | Klaviyo migrations, paid media management, CRO, theme upgrades |
| $1 million+ | High ($5k–$20k+) | Dedicated roles: CMO, Head of Growth, Ecommerce Manager | Advanced: Shopify Plus, 6–10+ apps, 3+ tracking pixels, custom theme | Retention systems, multi-channel attribution, complex integrations, full redesigns |
Start with revenue to set the right service level. Then use stack depth and traffic to fine-tune the pitch.
Here’s why that works: 75.7% of Shopify stores are basic, running only 1–2 apps. That makes the under-$250,000 group a poor fit for a big retainer in most cases. These stores are usually founder-run, so they’re often a better match for starter builds or basic audits.
The $250,000–$1 million band is usually the sweet spot for growth-focused work. This is where brands often need help with paid media, CRO, email setup, and theme changes, but still move fast enough to buy without a long internal process.
Once a store hits $1 million+, the stack usually gets more layered. More apps. More tracking. More people involved. That often means bigger projects, deeper systems work, and a stronger case for higher-ticket services.
So, use revenue as your first budget signal. Traffic can help back it up, but revenue should lead the call.
Use these tiers to sort leads into pass, nurture, or prioritize before you score the other signals.
How To Turn These Signals Into a Simple Qualification Workflow
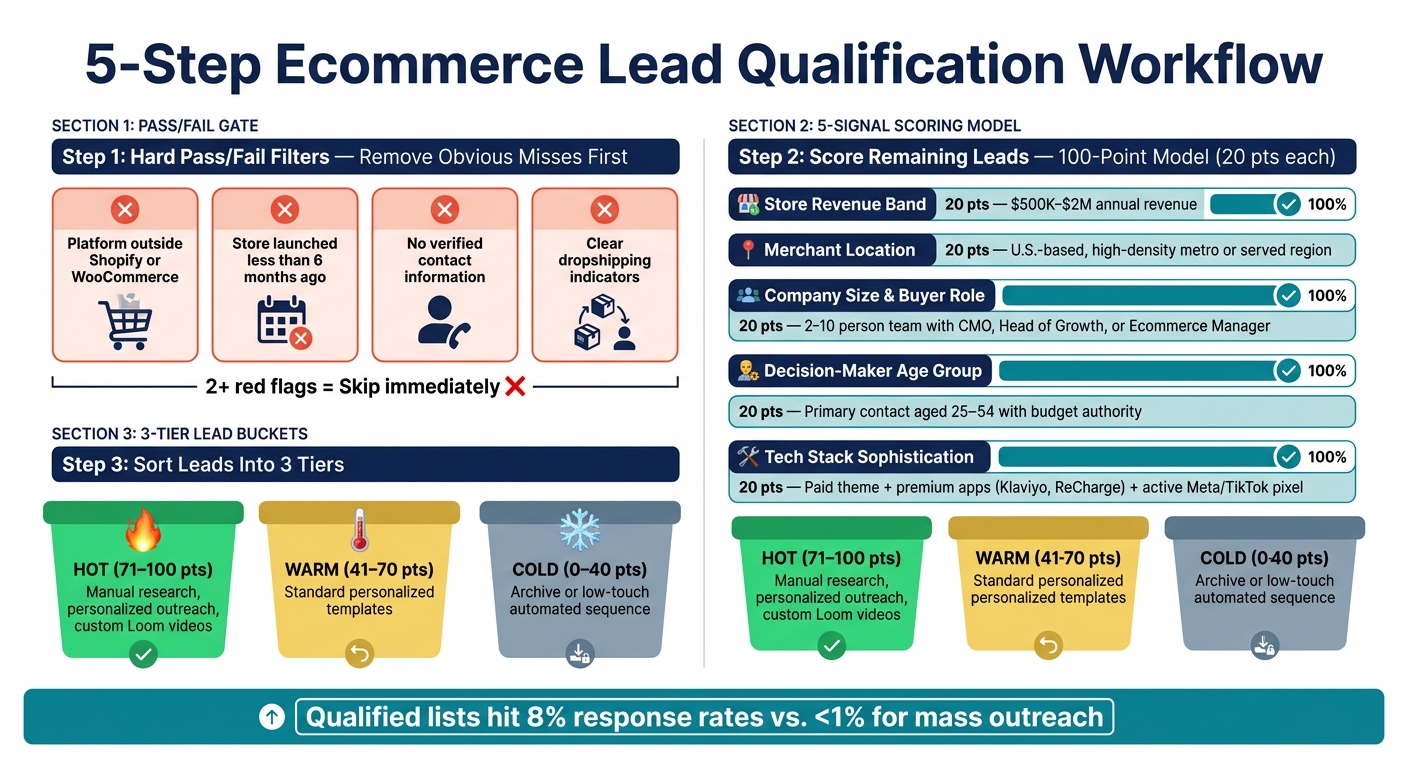
5-Step Ecommerce Lead Qualification Workflow
Turn the five signals into a simple filter: qualify fast, then score what’s left. The point is to use a repeatable process that keeps weak-fit stores out of your pipeline without wasting time. Start with a hard pass/fail gate. Then score the stores that make it through.
Set Pass-Fail Filters First
Before you score anything, cut the obvious misses.
These are your non-negotiables. If a store fails here, skip it right away and don’t assign any points.
For ecommerce agencies, common pass/fail filters include:
- A platform outside Shopify or WooCommerce
- A store launched less than 6 months ago
- No verified contact information
- Clear dropshipping indicators
If a store shows two or more of these red flags, move on.
Once you’ve cleaned the list, assign points to the five signals.
Assign Points to the 5 Demographic Signals
After removing the obvious misses, score the remaining leads with a simple 100-point model. Give each signal up to 20 points based on fit.
| Signal | Max Points | What Earns Full Points |
|---|---|---|
| Store Revenue Band | 20 pts | $500K–$2M annual revenue |
| Merchant Location | 20 pts | U.S.-based, in a high-density metro or region you serve |
| Company Size and Buyer Role | 20 pts | 2–10 person team with an identifiable CMO, Head of Growth, or Ecommerce Manager |
| Decision-Maker Age Group | 20 pts | Primary contact in the 25–54 range with budget authority |
| Tech Stack Sophistication | 20 pts | Paid theme, premium apps like Klaviyo or ReCharge, active Meta or TikTok pixel |
You can also subtract points for soft misses that don’t knock a lead out completely. Say a store looks strong overall but has no paid theme, no premium apps, or no active ad pixels. That kind of gap should lower the score, even if it doesn’t end the review.
Use a 3-Tier Lead Score
Once scored, sort every lead into one of three buckets:
- Hot (71–100): Prioritize now. Use manual research, personalized outreach, and custom Loom videos.
- Warm (41–70): Nurture with standard personalized templates.
- Cold (0–40): Archive or move into a low-touch automated sequence.
This score shouldn’t just sit in a report. It should shape how you build lists and where your team spends time.
Build Lists Faster
Once leads are scored, stop researching stores one by one. Filter at scale instead.
StoreCensus lets you search 6M+ Shopify and WooCommerce stores by revenue, tech stack, theme, country, and growth signals. You can also surface verified decision-maker contacts right in the results.
Here’s a practical example: filter for U.S.-based Shopify stores with estimated revenue between $500K and $2M, an active Facebook Pixel, and no visible email marketing app. That mismatch - strong ad spend, but a gap in retention infrastructure - is a strong buying signal.
Conclusion
When you look at age, location, revenue, company size, and tech stack together, agencies get a much cleaner way to qualify ecommerce leads. These demographic signals help filter out low-fit stores before outreach even begins.
That’s why lead scoring works best when you combine signals instead of looking at each one on its own. One data point won’t close a lead. Fit comes from the mix.
The data backs that up: qualified lists can reach 8% response rates, compared with less than 1% for unqualified mass outreach. That’s the edge here - fewer dead ends, more sales-ready accounts, and more time spent on stores that can actually buy.
FAQs
How accurate are demographic lead signals?
Demographic signals can help qualify ecommerce leads, but they work best inside a multi-layered scoring system. On their own, they only tell you part of the story.
Data points like location or category can show whether a store lines up with your offer. But that alone doesn't prove lead quality.
For a better read, pair demographic signals with firmographic and behavioral data, such as revenue range, traffic tiers, and tech stack. Tools like StoreCensus can help you filter for higher-potential accounts instead of leaning on vanity metrics.
What should I do if a store fits some signals but not all?
Use a structured lead scoring model instead of treating qualification like an all-or-nothing call.
Split your signals into must-haves and nice-to-haves. If a store misses a must-have, disqualify it.
If a store checks only some boxes, use its score to decide what happens next:
- Nurture it
- Include it in broad outreach
- Monitor it for later growth signals
StoreCensus can help enrich these profiles with more detailed data.
How often should I update my lead scoring criteria?
Treat lead scoring as a living process, not a set-it-and-forget-it task. When conversion rates shift or you start seeing new traits among your best clients, go back and update your criteria.
That kind of regular check keeps your top-score segments aligned with the stores most likely to have the budget and the drive to grow. StoreCensus can help here by tightening your scoring model as new store data and interaction data come in over time.