Support Responsiveness Benchmarks by Store Tier
Assess support speed, channels, and escalation by store tier to prioritize outreach and qualify agency leads.

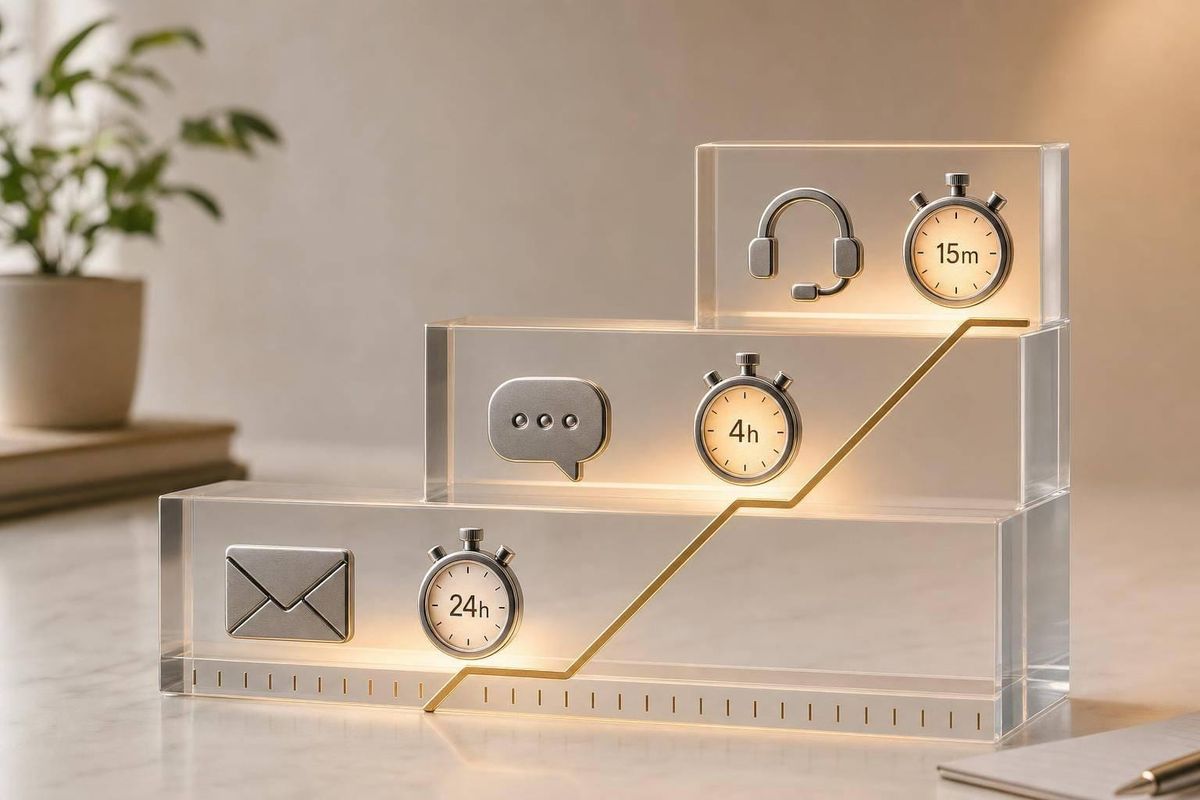
Support speed tells me how a store is set up - and how easy it may be to sell into.
If I need a fast way to judge store maturity, I use Shopify store guides to look at four things: first reply time, channel mix, escalation path, and after-hours coverage. Small stores often rely on one founder and one inbox. Mid-market stores usually have a CX or ops owner and more support channels. Plus-level stores tend to route issues by function, with more than one contact and better escalation paths.
Here’s the short version:
- Small stores: slower replies, thin coverage, and founder-led support
- Mid-market stores: better contact rates, more apps, and some team-based routing
- Plus-level stores: stronger contact access, more role-based support, and faster handoffs
- Best outbound target: stores with 50K+ monthly traffic, where access and budget are more likely to line up
- Best signal to watch: a store with 50K+ traffic, 5+ apps, and no visible support app may be underbuilt for its volume
A few numbers stand out right away:
- In the under 50K traffic group, only 30.2% of stores have any verified contact
- In the 1M–5M traffic group, 56.3% have a verified contact, and 33.3% have 2+ contacts
- Mid-market stores in the 50K–200K band reach 85.2% contactability
- Stores above 50K monthly traffic average a 96.9 lead fit score
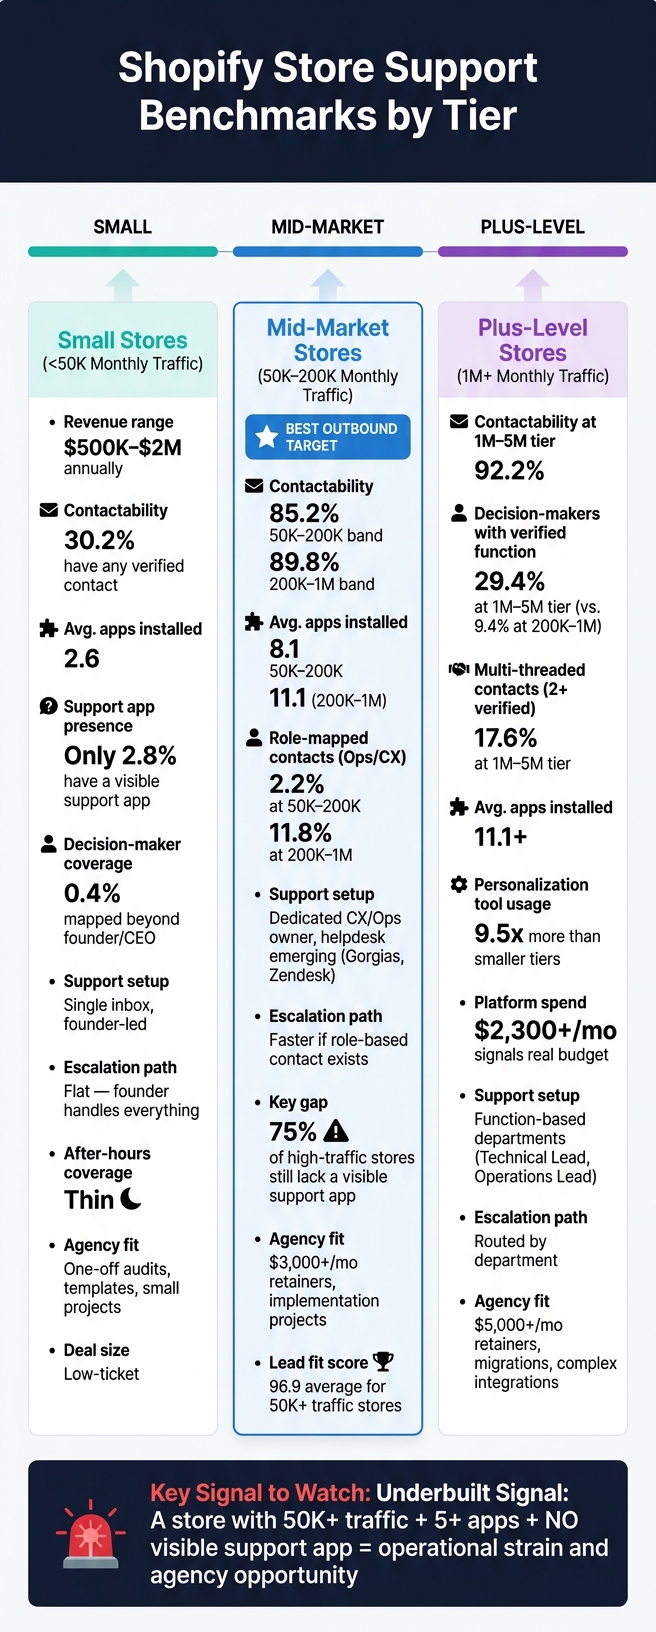
Shopify Store Support Benchmarks by Tier: Contact Access, Apps & Agency Fit
Quick Comparison
| Store tier | Support setup | Contact access | Escalation path | Agency fit |
|---|---|---|---|---|
| Small | One inbox, one person | Low | Founder handles most issues | Best for one-off work or small audits |
| Mid-market | Helpdesk starts to appear | Better | Faster if role-based contacts exist | Best mix of reach and budget |
| Plus-level | Team-based, function-led | Highest | Routed by department | Better for larger retainers and multi-contact outreach |
So if I’m qualifying Shopify brand prospect lists, I don’t treat support as just a CX metric. I use it as a simple filter for access, budget, and sales complexity.
sbb-itb-61169e3
1. Small stores
Small stores - usually those with under 50K monthly traffic or annual revenue between $500K and $2M - tend to run on a solo founder setup. In plain English, one person is doing almost everything. There’s often a single inbox, no formal SLA, and not much backup when that person is tied up. You see the strain first in reply speed, then in channel options and escalation.
First reply window
Replies tend to be slow and uneven because one person is handling every incoming message.
Channel depth
The next choke point is channel breadth. Most small stores lean on a generic info@ inbox or a basic contact form. Only 2.8% of stores in this tier have a visible support app installed, and they average just 2.6 apps total [3].
Escalation speed
When a problem turns technical, the founder becomes the bottleneck. Escalation is flat: the founder handles most decisions, including technical issues. Only 0.4% of stores in this tier map a decision-maker beyond the founder/CEO [4].
After-hours coverage
After-hours coverage is thin. If orders spike or the site breaks, WISMO tickets are often an early sign that coverage was missed [4][3].
Mid-market stores start to show team-based coverage and faster escalation.
2. Mid-market stores
Mid-market stores are usually past the founder-checks-everything stage. Support now sits with a named CX or operations owner, which changes how the whole system runs. You see it first in faster replies, then in broader channel coverage, and then in fewer slow handoffs when something needs to move up the chain.
First reply window
With dedicated staff in place instead of a busy founder juggling support, first replies are usually faster and more steady. The contactability data makes that pretty clear: 85.2% of stores in the 50K–200K traffic tier are reachable, compared with 69.7% for small stores [1]. In the 200K–1M traffic tier, that climbs to 89.8% [1].
More reachable contacts usually leads to faster first replies and fewer delays between teams. It’s a simple shift, but it matters.
Channel depth
This is where mid-market stores start to look different in a way you can feel. A lot of them have moved past a generic info@ inbox and into a dedicated helpdesk. Gorgias Chat and Zendesk are common signs at this level.
The app data points in the same direction. Mid-market stores in the 50K–200K band average 8.1 detected apps, while upper mid-market stores average 11.1 [4]. More apps doesn’t just mean a busier stack. It usually points to more structured routing and clearer ownership.
There’s also a gap here that stands out. Only 25% of the highest-scoring Shopify stores have a visible support app installed [3]. Put plainly, three out of four high-traffic mid-market stores are still handling support through channels that weren’t built for higher volume. For agencies selling CX or operations help, that’s a clear opening.
After-hours coverage
After-hours coverage is still uneven, even for stores big enough to justify automation. In other words, plenty of these teams have grown, but their support setup still hasn’t caught up. Automation is still underbuilt at this tier [3].
Escalation speed
Escalation is faster than in the small-store tier, but there’s a catch: it depends a lot on whether there’s a mapped functional role. If there’s a direct contact in Operations or CX, a technical or order issue can get fixed in one call. If not, the request often drops back into a generic inbox and slows down again.
The numbers show that split. In the 50K–200K band, only 2.2% of stores have a verified contact mapped to a role like Operations or CX [5]. In the 200K–1M band, that jumps to 11.8% [5].
That’s better, but it still leaves a lot of stores without a direct path when something goes sideways. At the next tier, escalation gets more direct.
3. Plus-level stores
Plus-level stores shift support out of the founder’s hands and into actual departments. In plain English: instead of one person wearing five hats, ownership starts to sit with the team that should handle the issue in the first place.
First reply window
First replies tend to move faster here because inbound contacts connect to real job functions. At the 1M–5M monthly traffic tier, contactability reaches 92.2%, and 29.4% of stores have at least one verified decision-maker tied to a specific function [4]. That’s a clear step up from the 9.4% verified coverage in the 200K–1M band [4].
Channel depth
Plus stores also run deeper app stacks than mid-market stores, with an average of 11.1 detected apps at the 200K–1M tier [4]. More tools don’t fix support on their own, of course. But they often point to clearer routing, more defined roles, and less guesswork about where a request should go.
Escalation speed
At this level, tickets are less likely to sit in a catch-all inbox. They move to the department that owns the fix. Technical issues and site-speed problems route to a Technical Lead, while shipping, returns, and order tracking go to an Operations Lead [4].
That change matters when a case touches more than one team. Multi-threaded decision-making - defined here as 2+ verified contacts at the same store - appears in 17.6% of stores in the 1M–5M traffic tier [4]. So when a ticket needs input from more than one function, there’s less chance it gets stuck behind a single person.
After-hours coverage
After-hours coverage still trails daytime support, even at this stage. That leaves automation and routing as the clearest gap - and the clearest opening for automation-led CX work.
Pros and cons of tier-based support benchmarks for agency qualification
Support responsiveness is more than a customer service metric. It can help qualify an account. In practice, it points to three things: access, budget, and how hard the sales process is likely to be. And those signals change a lot by store tier.
| Store Tier | Advantages | Drawbacks | Qualification Signals | Likely Deal Implications |
|---|---|---|---|---|
| Small (<50K traffic) | Direct founder access | Low verified contact coverage (30.2%); limited budgets [3] | Avg. 2.6 apps; low app depth [3] | Low-ticket audits, templates, or one-off projects [3] |
| Mid-Market (50K–200K traffic) | Strong contactability (85.2%); avg. 8.1 detected apps [4] | Gatekeepers separate support from budget owners; high competition [3] | 5+ apps; verified Marketing or Ecommerce leads [4] | $3,000+/mo retainers; implementation projects [3] |
| Plus-Level (1M+ traffic) | Platform spend of $2,300+/mo signals real budget [2]; higher decision-maker access [4] | Support is separate from buying power; complex buying committees and long sales cycles [2][4] | Shopify Plus status; 11+ apps; 9.5x more personalization tool usage [2][4] | $5,000+/mo retainers; migrations; complex integrations [2][4] |
The table gives you the shape of the market. But the bigger point is how to find and target Shopify stores based on what each tier means for outreach.
Mid-market is usually the best outbound target. These stores are big enough to pay for agency work, but still reachable. That mix matters. You’re not stuck chasing tiny budgets, and you’re not walking straight into a maze of committees.
For this tier, generic support inboxes are a weak path. It’s better to route outreach to a verified functional contact, like someone in Marketing, Ecommerce, or Operations. That same logic becomes even more important with Plus-level accounts. At that level, role-based routing beats generic inbox outreach every time.
At the Plus tier, responsiveness tells you less about buying intent and more about team structure. A fast or organized support motion often signals an operation with defined roles and systems in place. That’s helpful, but it’s only the first filter. After that, qualification should come from role data and growth signals.
That’s where tools like StoreCensus come in handy. Agencies can layer Shopify Plus status with tech stack and growth signals, such as recent theme changes or new app installs, then export lists with decision-maker contacts attached. In plain English: you can focus on stores that are already spending money and changing their setup, which is often when agency demand shows up.
One of the strongest signals is the mismatch between traffic and support infrastructure. A store with 50K+ traffic and 5+ apps but no visible support app can be underbuilt for its volume. That kind of gap is worth attention, because it often points to operational strain, internal bandwidth issues, or a store that has grown faster than its systems.
Conclusion
Support response patterns change by store tier. When you look at reply windows, channel depth, and escalation speed, the same theme shows up again and again: as stores get more mature, their support setup gets more structured.
Small stores tend to stay founder-led. Mid-market stores usually bring in a dedicated CX owner. Plus-level stores shift to function-based support. At the 1M–5M traffic tier, decision-maker coverage reaches 29.4% [4]. That changes the buying setup in a very direct way.
Use 50K+ monthly traffic as your main filter. Stores above that line average a 96.9 lead fit score [3]. In plain English, support structure isn’t just a service detail. It helps you qualify the account. Send outreach to a verified functional contact instead of a generic inbox, and line up your pitch with what each tier actually needs. Plus-level accounts need multi-threaded outreach and verified decision-maker contacts [3][4].
Agencies that benchmark by tier tend to qualify faster, pitch with better aim, and spend less time on dead-end accounts. That’s why tier-based support benchmarks help agencies qualify accounts faster.
FAQs
How can I estimate reply speed without sending a test message?
Estimate reply speed by looking at firmographic and behavioral signals instead of sending test messages. A merchant’s business stage, comfort with budget approvals, and openness to new tools can hint at how fast their team tends to respond.
With StoreCensus, you can check Shopify Plus status, traffic tiers, tech stack attributes, revenue tier, and growth signals like theme changes or new app installs. Those signals help you judge operational maturity and sort stores by likely responsiveness.
Why is 50K+ monthly traffic the key cutoff?
Because 50,000 monthly visitors is where commercial value and lead quality take a clear step up. Stores above that line average lead fit scores of 96.9, compared with 60.2 for stores below it.
At this level, verified contact coverage and decision-maker availability improve too, which makes outreach easier and less wasteful. These stores also tend to run larger app stacks, deal with more complex needs, and have the budget for higher-ticket agency retainers.
What does it mean if a store has 5+ apps but no visible support app?
It usually points to a clear gap in how the store runs. The merchant is far enough along to pay for 5+ apps tied to growth, marketing, or tracking, but may still be missing the customer service setup needed to handle that level of scale.
For agencies, that can be a strong buying signal. The merchant likely has budget and a solid operation in place, yet still lacks a key system for handling customer conversations, retention, and escalations.