
Social Commerce Analytics for Shopify Agencies
Help Shopify agencies fix attribution, measure blended ROAS, add server-side tracking and UTMs, and build clear client dashboards.

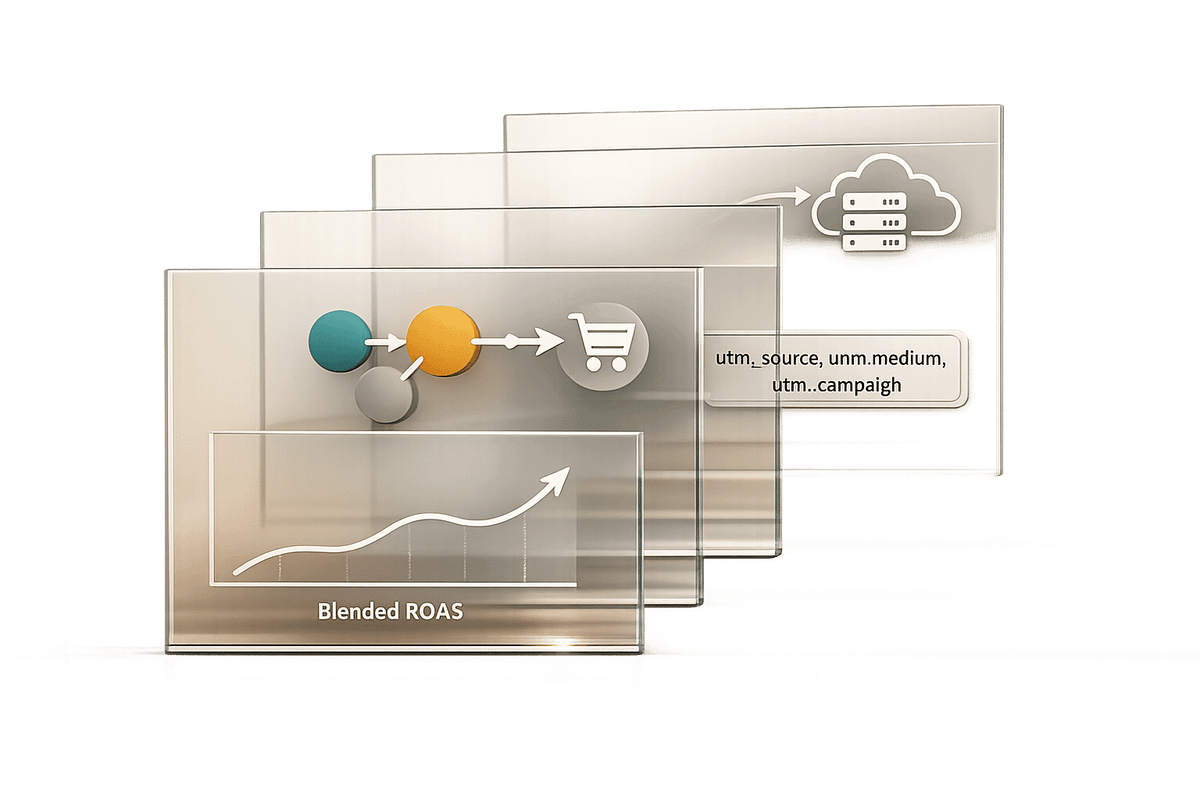
Social commerce is booming, with U.S. sales projected to hit $114.7 billion by 2026. Yet, one major issue persists: attribution. Platforms like TikTok, Meta, and Google often overstate their impact, leaving Shopify agencies struggling to pinpoint which channels truly drive revenue. This creates an opportunity for agencies to step up with better analytics systems.
Key takeaways:
- 93.85% of Shopify stores lack dedicated analytics tools, despite heavy ad spending.
- Platform-reported conversions often exceed actual Shopify orders by 150–200%.
- Metrics like Blended ROAS, Customer Acquisition Cost (CAC), and repeat purchase rates provide a clearer picture of performance.
- Tools like UTMs, server-side tracking (e.g., Meta's CAPI), and clean product feeds are essential for accurate reporting.
Agencies that solve attribution challenges can move from being service providers to trusted partners, using data to improve campaigns, diagnose funnel issues, and retain clients long-term.
Key Social Commerce Metrics to Track
Core Metrics Every Agency Should Measure
When measuring campaign performance, focusing solely on revenue can be misleading. It’s crucial to dig deeper to understand profitability and identify potential problem areas.
Start by breaking down revenue into three categories: Gross Sales (total revenue before deductions), Net Sales (Gross Sales minus discounts and returns), and Total Sales (Net Sales plus shipping and taxes). For accurate ROAS calculations and a clearer view of product performance, Net Sales is the go-to metric, as it filters out the noise caused by discounts and returns.
Another area to analyze is the conversion funnel: Sessions → Product Views → Add-to-Cart → Checkout → Purchase. This helps you identify where customers drop off. For example, if add-to-cart rates are high but checkout rates are low, the issue might be related to payment or shipping. On the other hand, low product views could indicate weak traffic quality.
Metrics like Customer Acquisition Cost (CAC) and repeat purchase rate are equally important. CAC shows how much you’re spending to acquire a customer, while the repeat purchase rate reveals whether those customers are sticking around. Together, these metrics help determine whether social ad spend is building a lasting customer base or just driving short-term sales.
A particularly insightful metric is Blended ROAS, which calculates total revenue divided by total ad spend across all channels. Unlike platform-reported ROAS (e.g., from Meta or Google), which can be inflated by factors like overlapping attribution windows, Blended ROAS gives a more realistic view. In fact, platform-reported ROAS is often 30–60% higher than Blended ROAS.
"Platform-reported ROAS is a marketing number. Blended ROAS is a finance number. Your job as a founder is to run the business on finance numbers." - EcomAIOS
To ensure profitability, apply the break-even ROAS formula: 1 ÷ Gross Margin %. For instance, a client with a 50% margin needs at least a 2.0x Blended ROAS to break even on ad spend. Anything below this threshold indicates a loss, regardless of what platform metrics suggest.
Once you’ve nailed down these core metrics, dive into platform-specific data to refine your strategy further.
Platform-Specific Metrics That Matter
Each social platform has unique metrics that can shed light on campaign performance:
| Platform | Key Metric to Monitor | Why It Matters |
|---|---|---|
| TikTok Shop | Video Completion Rate | Completion rates above 25–30% boost algorithmic distribution. |
| Saves | Indicates high purchase intent and future buying potential. | |
| Outbound Clicks | Tracks the transition from discovery to action. | |
| YouTube | Audience Retention | Highlights where viewers lose interest in product demos. |
For TikTok, an essential metric is the Content-to-Cart Rate, which measures the percentage of viewers adding products to their cart after watching tagged content. This metric often predicts revenue better than raw view counts. Similarly, Instagram Reels with product tags outperform static posts with 3–5x higher engagement, making them a valuable tool for optimization.
Live shopping events also deserve attention. Beginner sellers should aim for a 2–4% viewer-to-purchase rate, while experienced sellers should target 5–10%. Live commerce is gaining traction, with conversion rates that are 10–15x higher than static listings and projections suggesting it could account for 10–20% of all ecommerce by late 2026.
How to Track Attribution Across Channels
Tracking attribution in social commerce can be tricky, as platforms often overstate their contributions. For example, the combined sales reported by Meta, TikTok, and Google might exceed your actual Shopify order count. To cut through this noise, UTM parameters are your best bet.
Use a consistent naming convention like utm_source=tiktok&utm_medium=paid-social and document it in a shared sheet for team-wide consistency. Inconsistent formatting can fragment your data in Shopify Analytics and GA4, making it harder to compare results across channels.
Given that 75% of iPhone users have opted out of tracking via iOS App Tracking Transparency, server-side tracking is now essential. Tools like Meta’s Conversions API or TikTok’s Events API, when paired with platforms such as Analyzify or Elevar, can recover 25–40% of events missed by browser-based tracking. Running both browser and server-side tracking simultaneously ensures a more complete data set without double-counting.
Finally, consider your attribution model. Shopify defaults to a 30-day last-click window, which tends to undervalue discovery platforms like TikTok and Pinterest. A position-based model - assigning 40% credit to the first touch, 40% to the last touch, and the remaining 20% to interactions in between - provides a more balanced view. Choosing the right model is critical for generating accurate and actionable analytics reports.
sbb-itb-61169e3
How to Set Up Tracking Across Shopify and Social Platforms

Setting Up Shopify and Social Platform Tracking Tools
To ensure accurate social commerce analytics, you need a tracking setup that goes beyond browser-based visibility. Why? Because ad blockers impact 30–42% of internet users, meaning browser pixels alone miss a significant portion of conversion data.
The best approach combines browser pixels with server-side APIs. For Meta, this means using both the Meta Pixel and the Conversions API (CAPI). TikTok requires the Pixel along with the Events API. To avoid double-counting and improve ad delivery, ensure both layers share a common event_id.
"Shopify's native Meta CAPI integration has a critical flaw - the trigger is still browser-based, so ad blockers can still prevent server events from firing." - SignalBridge
Analyzing a Shopify tech stack reveals that built-in integrations are a good starting point, but they have limitations. If you're managing clients spending more than $10,000/month on Meta or TikTok ads, server-side tools like SignalBridge ($29/month) or Converlay (which offers a free tier) provide better data recovery with minimal setup.
Another issue arises when customers use Shop Pay during checkout. They're redirected to pay.shopify.com, which often breaks GA4 browser-based tracking. The solution? Implement the GA4 Measurement Protocol to capture these purchase events server-side. To spot this issue, compare GA4 purchase event data with Shopify's "Sales over time" report. If there's a gap greater than 10%, it's a sign your tracking is failing.
Once your tracking is solid, the next step is creating a clear UTM naming system for accurate multi-channel analysis.
Building a UTM Naming System for Multi-Channel Campaigns
A consistent UTM naming system is essential for clean, reliable reporting. Without it, traffic sources like "FB", "Facebook", and "facebook" will be treated as separate, fragmenting your data.
"UTM parameters are your single source of truth." - theshopstrategy.com
The five key UTM parameters to use are utm_source, utm_medium, utm_campaign, utm_content, and utm_term. Stick to lowercase letters, use underscores instead of spaces, and include detailed identifiers (e.g., utm_campaign=clientA_spring_sale_2026) for clarity. Agencies managing multiple accounts should append a client identifier to campaigns to keep cross-account reporting clean. For influencer campaigns, tag traffic separately with utm_medium=influencer and utm_content=creator_name to evaluate individual ROI without blending it into paid social data.
To keep everyone on the same page, document your naming conventions in a shared reference sheet. This step is non-negotiable for ensuring team-wide consistency.
While UTMs ensure data consistency, maintaining clean product feeds is equally important for reliable ad performance.
Keeping Product Catalog Feeds Clean and Synced
Accurate product data is critical for effective social commerce. A messy product feed - think outdated prices, missing images, or mismatched inventory - can lead to disapproved listings, poor ad delivery, and unhappy customers.
Shopify should act as your single source of truth for all product data. From there, you can sync feeds to platforms like TikTok Shop, Meta Shops, Instagram, and Pinterest. For stores with fewer than 100 SKUs, Shopify's native integrations are usually sufficient, syncing automatically every 1–4 hours. However, if you're managing 5,000+ SKUs, tools like Feedonomics, DataFeedWatch, or Channable are worth considering. They offer rule-based automation and advanced mapping for better feed management.
Each platform has its own requirements. TikTok, for example, often demands white background primary images and brand authorization letters for branded products. Meta assigns a Catalog Health Score, and you should aim for a score above 80% to maintain visibility. To avoid overselling during high-traffic periods, set a 5–10% inventory buffer in Shopify.
Finally, conduct monthly feed audits to catch policy violations. Items like digital goods or alcohol often trigger automatic rejections, which can hurt your reach if left unaddressed.
Shopify Analytics Tutorial: How to Track Conversions and Customer Behavior
How to Build Client Reporting Dashboards
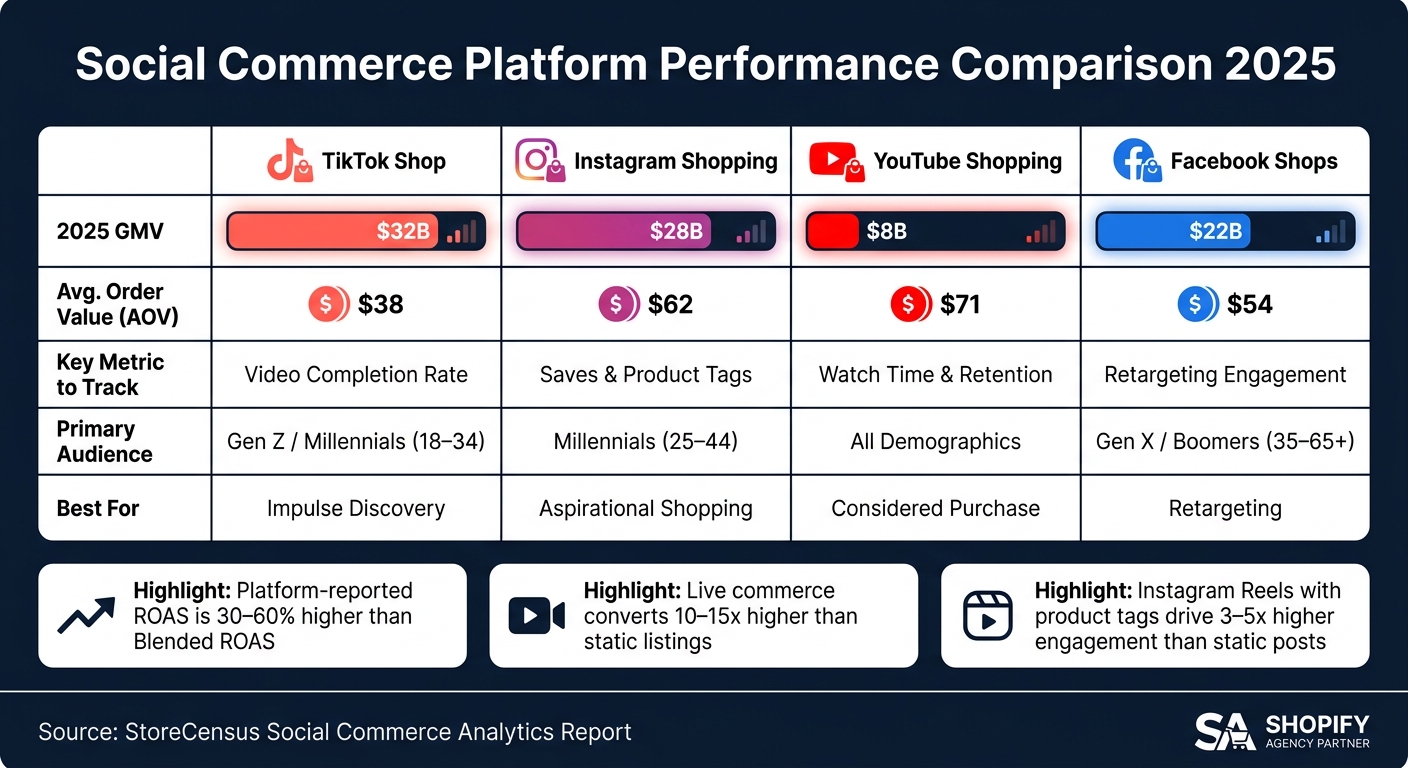
Social Commerce Platform Comparison: GMV, AOV & Key Metrics (2025)
Once you've nailed down clean tracking and consistent UTMs, the next step is turning all that raw data into reports that clients can easily understand and use.
Organizing Data by Channel, Campaign, and Product
Start by structuring dashboards into two distinct layers:
- Headline Tier: This is where you showcase the big-picture metrics that matter most on a daily or weekly basis. Think revenue by platform, blended ROAS, total sessions, conversion rate, and cost per acquisition.
- Diagnostic Tier: This layer dives deeper, offering detailed insights like add-to-cart rates, video completions, engagement stats, and audience overlap.
By keeping these layers separate, clients can focus on the high-level numbers, while your team has the granular data needed for troubleshooting and optimization. Don’t forget to monitor SKU performance as well. Pinpoint low-margin products and decide whether to reprice, scale, or cut them entirely.
"Clients prioritize metrics that directly impact revenue." - Dashboardly
This two-tiered structure ensures clarity and makes it easier to deliver actionable insights across all platforms.
Aligning Metrics Across Platforms for Consistent Reporting
Once your data is organized, the next priority is consistency. Since attribution can be tricky, base your reports on Shopify’s verified revenue data. Use UTM-sourced sessions as the bridge to reconcile platform-reported numbers with actual performance.
A key metric to include is blended ROAS - total ad spend across all platforms divided by total Shopify revenue. As EcomAIOS explains: "Blended ROAS is the honest number. It's also the number that hurts." To make things even clearer, add a "Platform-reported vs. Actual" column. This way, clients can see any discrepancies and make smarter budget decisions.
For example, in April 2026, the fashion brand The Littl implemented a multi-channel attribution system that connected 12 data sources, including Shopify, Meta, and TikTok. They discovered Meta was overclaiming revenue by 60%. This insight allowed them to cut ad spend by 15%, improve their blended ROAS, and save 27.5 hours per week on manual reporting.
Comparing Channel Performance Side by Side
Each platform plays a unique role in the customer journey, so comparing them using identical metrics doesn’t make sense. Instead, focus on what each platform does best:
- TikTok is all about impulse discovery, so track video completion rates as a key indicator.
- Instagram leans aspirational, making Saves a strong signal of high intent.
- YouTube attracts buyers who are further along in the decision-making process, so prioritize watch time and retention.
Once you’ve identified the right metrics for each platform, present them in a side-by-side view for easy comparison:
| Platform | 2025 GMV | Avg. Order Value | Key Metric to Track | Primary Audience |
|---|---|---|---|---|
| TikTok Shop | $32B | $38 | Video Completion Rate | Gen Z / Millennials (18–34) |
| Instagram Shopping | $28B | $62 | Saves & Product Tags | Millennials (25–44) |
| YouTube Shopping | $8B | $71 | Watch Time & Retention | All demographics |
| Facebook Shops | $22B | $54 | Retargeting Engagement | Gen X / Boomers (35–65+) |
This side-by-side comparison makes budget decisions straightforward by connecting metrics like average order value (AOV) and conversions directly to spending shifts. To keep clients informed but not overwhelmed, consider giving them read-only access to the dashboard. This way, they stay in the loop without needing to navigate the backend details of campaign management.
How to Diagnose Performance Problems Using Analytics
Finding Where the Funnel Breaks Down
Social commerce performance issues often follow predictable patterns across the customer funnel. To pinpoint where users are dropping off, analyze the entire journey - from Ad → Landing Page → Product Page → Add to Cart → Checkout → Purchase. Each stage provides critical signals that can help diagnose the problem.
For example, platform-specific metrics can highlight weak points. On TikTok, if video completion rates are below 25–30%, it suggests your initial hook isn’t grabbing attention. On Instagram, high reach but low saves indicates content that captures attention but doesn’t inspire purchase intent. On Pinterest, lots of saves but few outbound clicks reveal content that feels aspirational rather than actionable.
Technical issues can be just as damaging as weak creative. A high add-to-cart rate but low checkout rate often points to friction, like unexpected shipping costs revealed too late in the process. Meanwhile, if your product page conversion rate is under 1.5%, spending more on ads won’t fix the issue - the page itself is likely the bottleneck. And don’t underestimate the impact of slow page load times; anything over 2.5 seconds is a major driver of drop-offs.
Signal quality also plays a big role. If Meta’s Conversions API (CAPI) isn’t active or Purchase events aren’t prioritized in Aggregated Events Measurement, ad platforms can’t optimize effectively. This often leads to higher CPAs. For instance, a 2026 study examining 541,000 Shopify stores revealed that 74% of high-traffic stores running paid media lacked a proper attribution layer, relying solely on GA4, which struggles to reconcile cross-channel discrepancies.
Once you’ve identified the issues, rank them by their impact and tackle them systematically.
Ranking and Fixing Issues Based on Data
After identifying where users drop off, use data to prioritize fixes. The table below outlines common funnel problems, their signals, and likely causes:
| Funnel Problem | Data Signal | Likely Root Cause |
|---|---|---|
| Weak Discovery | CTR below 0.5% | Weak creative hook or call-to-action (CTA) |
| Low Intent | High views / low saves | Content entertains but doesn’t encourage shopping |
| High Friction | High add-to-cart / low purchase | Unexpected shipping costs or a slow checkout process |
| Optimization Failure | Rising CPA / stable CTR | Broken CAPI or poorly prioritized events |
| Creative Fatigue | Ad frequency above 3–4 | Audience is overexposed to the ad |
Before tweaking creative elements or boosting ad spend, verify that your tracking is accurate. As RCKSTR Media aptly states:
"Your biggest performance leaks usually come from tracking, creative, and landing page issues - not your targeting."
For instance, if your click-through rate (CTR) is strong but conversions are lagging, the landing page may be the problem. Check for slow load speeds or unclear pricing. If CTR is low, the issue likely lies in the creative itself. Use tools like Meta Test Events and Shopify Customer Events to ensure add-to-cart and purchase counts align perfectly with Shopify order data. Any mismatch often signals a root cause of rising CPAs.
For businesses with heavy mobile traffic, implementing server-side tracking via Meta’s CAPI or TikTok’s Events API can help recover 20–40% of conversions obscured by iOS privacy updates. These insights lay the groundwork for building stronger, data-driven strategies in the next phase.
Using Social Commerce Data to Retain Clients
Using Data to Back Budget Decisions
One of the quickest ways to lose a client is by failing to provide clarity on where their dollars are going. The solution? Build channel-specific profit and loss (P&L) statements that reveal the hidden costs most platform dashboards conveniently leave out.
For example, TikTok Shop referral fees can range from 6–8%, affiliate commissions can tack on an additional 10–20%, and social return rates often hover between 12–22%. When you present these numbers transparently, you're not just crunching data - you’re showing an understanding of the business that builds trust.
Take Brandon Cohn, Head of Growth at Caraway Home, as an example. He shared this insight:
"We tested every channel hard in 2025. TikTok Shop drove volume but crushed our margins because the AOV was too low... Instagram Shopping became our primary social revenue driver."
This type of margin-focused analysis allows you to make informed budget reallocations. It’s not enough to tell a client a channel isn’t working - you need to explain why. When you provide this level of insight, you become a crucial partner in their decision-making process.
To maintain this trust, use headline metrics like platform revenue, ROAS, and total sessions for regular updates. Then, dive deeper with diagnostic metrics such as video completion rates, add-to-cart rates, and checkout drop-offs to identify and explain performance shifts.
Reporting That Builds Long-Term Client Relationships
Once you’ve justified budget decisions with clear data, the next step is delivering reports that foster lasting relationships.
Start every report with a concise executive summary - three to five sentences that highlight what’s working, what isn’t, and what’s planned next. Skip the vanity metrics. Metrics like follower counts and impressions might look good, but they don’t justify retainers. Instead, focus on actionable data like sales-attributed revenue, lifetime value (LTV) trends, and conversion path data.
Establish a reporting routine that balances frequency and depth:
- Daily: Quick ROAS checks.
- Weekly: Reviews of content performance.
- Monthly: Deep dives into cohort analysis and LTV.
The monthly review is where you can truly shine. Use tools like Shopify’s cohort reports to demonstrate that social channels are bringing in repeat buyers, not just one-time customers.
Don’t overlook the power of multi-touch attribution (MTA) in these sessions. Most clients rely on Shopify’s last-click data, which often undervalues awareness channels like TikTok or Pinterest. Explaining time-decay or position-based attribution models - like how a TikTok view contributed to a Meta retargeting conversion - shows a level of analytical skill that sets you apart.
Using StoreCensus to Find and Research Prospects
The foundation of client retention starts with choosing the right clients in the first place. Target merchants where your retainer represents about 0.5–1% of their annual revenue. This ensures your services feel valuable without creating constant budget-related friction.
Tools like StoreCensus make this process efficient. With access to over 6 million Shopify and WooCommerce stores, you can filter by revenue tier, tech stack, traffic volume, and even country. This data uncovers opportunities you can turn into pitches: 93.85% of Shopify stores analyzed lack a dedicated analytics or attribution app, and 92–96% haven’t implemented TikTok Pixel tracking. These aren’t just numbers - they’re conversation starters for cold outreach.
Timing is everything in outreach. Focus on Activity Signals like theme changes, new app installs, or catalog expansions - indicators that a merchant is actively investing in their business. For instance, a theme change is a natural moment to pitch design or conversion rate optimization (CRO) services. A new Klaviyo install signals readiness to discuss retention strategies and attribution. As Aditya Singh, founder of Oxify, explained:
"StoreCensus completely changed how we do outreach. We stopped guessing and started targeting stores based on niche, app usage stage, and real growth signals."
For the best results, prioritize stores with 10,000–50,000 monthly visitors - these often show rapid growth and have decision-makers who are easier to reach (39% accessibility rate). StoreCensus even provides direct emails and LinkedIn profiles for key contacts like founders, CMOs, and Heads of Growth. This ensures your outreach reaches the people who hold the purse strings, avoiding generic contact forms entirely.
Conclusion: Using Social Commerce Analytics to Grow Your Agency
By 2026, the most successful agencies aren’t just running better campaigns - they’re building solid systems that fuel long-term growth. With U.S. social commerce sales projected to exceed $100 billion this year, the real measure of success lies in how effectively you leverage data. These systems don’t just support campaign performance; they lay the groundwork for sustainable, data-driven expansion.
The key is turning raw data into actionable insights. Clean tracking and well-balanced reporting make it possible to transform vague metrics into clear strategies. For example, multi-touch attribution can connect a single TikTok view to a specific step in the buyer’s journey, offering accurate solutions instead of guesswork.
This data-centric mindset doesn’t just improve campaigns - it reshapes how you acquire clients. With precise tracking and transparent reporting, your agency can identify the right merchants, time your outreach based on real growth signals, and connect with key decision-makers in a crowded marketplace.
The benefits don’t stop at client acquisition. Agencies that scale successfully rely on data to guide quick, profitable decisions. Whether it’s clean tracking, honest reporting, or smarter prospecting, starting with one strong system can create a ripple effect. These foundational steps often distinguish agencies that thrive from those that stall.
Tools like StoreCensus can help your agency tap into the full potential of social commerce data, driving growth and keeping you ahead in a competitive landscape.
FAQs
How do I calculate blended ROAS correctly?
To figure out your blended ROAS (Return on Ad Spend), follow this simple formula:
Blended ROAS = Total Shopify Revenue ÷ Total Paid Ad Spend
Here’s how to break it down:
- Step 1: Pull your total revenue from Shopify Analytics. Make sure it includes all sources of income.
- Step 2: Add up the ad spend across every platform you're using - whether it’s Meta, Google, TikTok, or others.
- Step 3: Divide the total revenue by the combined ad spend. This gives you a clear picture of how efficiently your ad dollars are driving revenue.
It’s a straightforward way to measure overall performance across multiple channels.
Which attribution model should we use for social commerce?
Social commerce thrives on discovery-driven journeys, which means a straightforward last-click model often misses the mark, especially when it comes to channels like TikTok or Instagram that are key for building awareness. Instead, consider a hybrid model, such as the U-shaped approach. This method gives credit to both the discovery phase (first touch) and the conversion phase (last touch), offering a more balanced view.
For more complex tracking needs, you might want to look into data-driven or AI-powered models. These can help measure things like view-through exposure and the incremental impact of your campaigns. The goal? To focus on metrics that directly influence revenue, rather than getting caught up in vanity numbers.
When should an agency add server-side tracking on Shopify?
Agencies should consider server-side tracking as their clients' ad budgets and data requirements increase. For stores spending less than $1,000 per month and seeing minimal iOS traffic, browser-side tracking might still do the job. But once ad spend reaches the $5,000–$10,000 range - or when tools like Shop Pay or advanced bidding strategies (like Google Smart Bidding) come into play - server-side tracking becomes critical to prevent data loss. It's equally important for headless storefronts or stores where ad blockers are heavily used.