Shopify Revenue Estimation Tools Compared
Compare methods to estimate Shopify store revenue — databases, spy extensions, traffic platforms, manual models, and Shopify Analytics.


If I need a fast answer, here it is: no Shopify revenue tool is exact unless I have access to the store’s own Shopify Analytics. For outbound, lead scoring, and account ranking, I’d use third-party tools as directional signals and not as hard revenue data.
Here’s the short version:
- StoreCensus is best when I need to sort and find and target Shopify stores by estimated revenue, app stack, country, and contact data.
- Browser extensions are best when I want to check one store at a time.
- Traffic platforms help me compare stores at the market level, but they get less steady on lower-traffic sites.
- Manual calculators are fine for rough revenue bands when I know the niche, traffic, and price points.
- First-party Shopify Analytics is the only source with actual sales, refunds, and order data, but I can only use it if I have admin access.
A few numbers matter right away:
- StoreCensus says 70%–85% accuracy for revenue estimates
- Browser spy tools often land around 30%–50%
- Traffic platforms can get within 15%–25% on larger stores, but often miss by 30%–50% on smaller ones
- Manual triangulation can cut error to about 20%–30% when I check traffic, app stack, and ads together
- Shopify Analytics is the benchmark because it uses actual store data
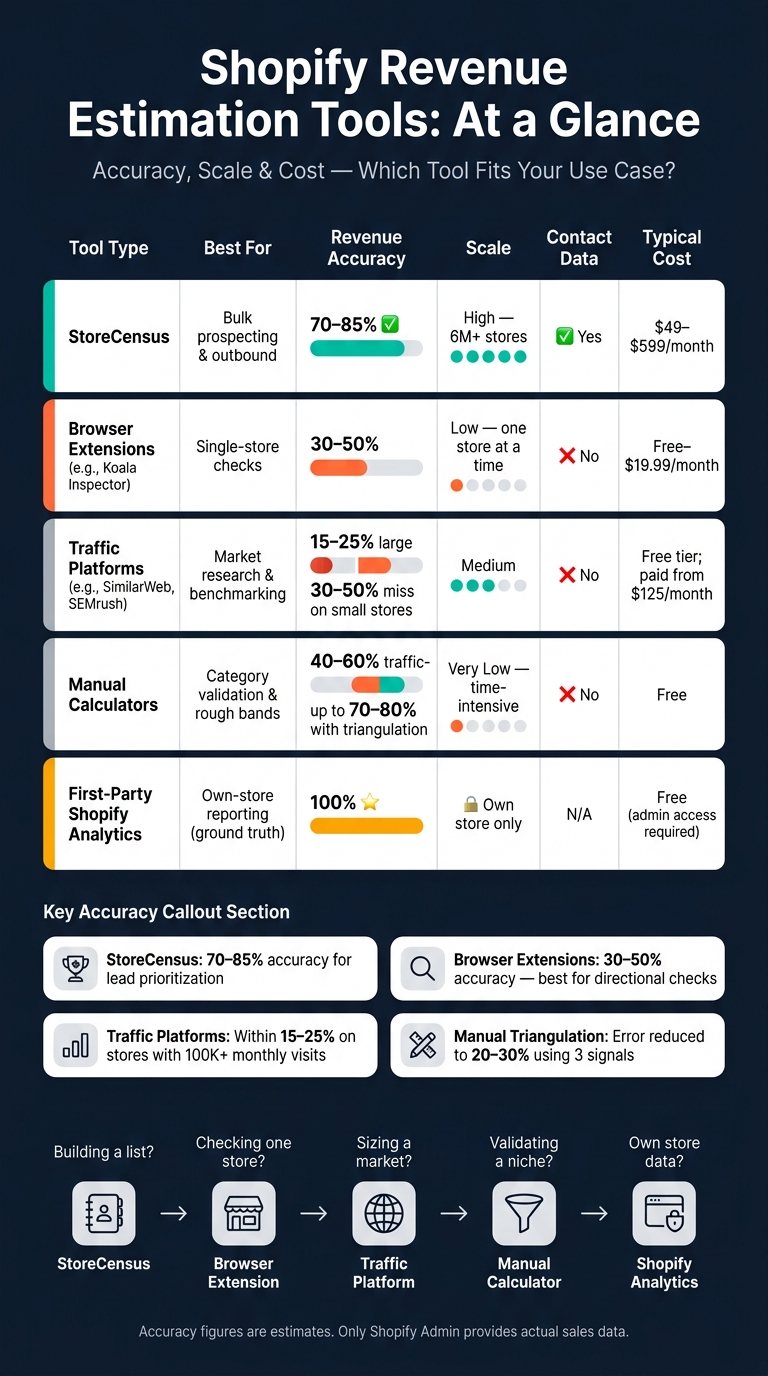
Shopify Revenue Estimation Tools Compared: Accuracy, Scale & Cost
How to find any Shopify Store's Revenue Accurately
sbb-itb-61169e3
Quick Comparison
| Tool type | Best for | Revenue accuracy | Scale | Contact data |
|---|---|---|---|---|
| StoreCensus | Bulk prospecting | 70%–85% | High | Yes |
| Browser extensions | Single-store checks | 30%–50% | Low | No |
| Traffic platforms | Market comparison | 15%–25% on larger stores; worse on smaller ones | Medium | No |
| Manual calculators | Rough validation | Varies; often 40%–60% on traffic-only models | Very low | No |
| Shopify Analytics | Own-store reporting | 100% | Own store only | N/A |
My takeaway: if I’m building lists, I want a store database. If I’m vetting one brand, I want an extension. If the call is high stakes, I check more than one signal. And if I need the actual number, I need Shopify admin access.
Below, I’d break down where each option fits, what the estimate is based on, and how much weight I should put on the number. For more detailed walkthroughs, see our Shopify store guides.
1. StoreCensus
StoreCensus is built for agencies and sales teams that prospect Shopify merchants at scale.
Estimation Method
StoreCensus estimates revenue using three signals: traffic, app stack, and product pricing data. It tracks 8,310+ Shopify apps, which helps sharpen those estimates by showing how sophisticated a store's setup is.
Accuracy for Prospecting
The platform says it delivers 70–85% revenue estimation accuracy. For prospecting, that's usually enough to sort high-value stores from lower-value ones and focus outreach where it has a better shot during lead qualification. This data helps agencies build a prospecting engine that converts more leads.
Data Depth
StoreCensus tracks more than 2 million Shopify stores and gives you 25+ data points per merchant, including app usage, theme, country, and growth signals. That level of detail also fits well into outbound work, especially when you're building Shopify brand prospect lists and narrowing targets.
Agency Fit
The Professional plan ($99/month) includes decision-maker search, a built-in CRM with tags and lists, and integrations with tools like Instantly.ai and SmartLead. It comes with 5,000 credits per month. Store exports cost 1 credit, and contact unlocks cost 2 credits each.
That makes StoreCensus a solid pick when your prospecting workflow needs revenue estimates, contact data, and list building in one place.
2. Browser Extension Shopify Spy Tools
For smaller research jobs, browser extensions are the fast, hands-on option. They work best when you want to check a few stores one by one, not when you're trying to build a huge lead list. Tools like Koala Inspector, Commerce Inspector, and PPSPY are made for manual review of single stores, not bulk prospecting.
Estimation Method
Most of these tools estimate revenue with a simple model: traffic × assumed conversion rate × Average Order Value (AOV). The assumed conversion rate usually falls between 1.4% and 3%, and AOV is pulled from public product pricing.
Some tools go a bit further. They watch changes in public product-page timestamps to guess when inventory is moving. A few even poll stores every 30 seconds to catch public order notifications.
That sounds useful, and it is, but there's a catch. The model relies on visible signals, not actual sales data. So the output is better used as a range or directional signal, not an exact revenue figure.
Accuracy for Prospecting
For prospecting, these tools are usually good enough to sort stores into rough buckets. But the revenue numbers themselves are often only 30% to 50% accurate.
So treat them like a screening tool. They can help you tell a low-value store from a high-value one, but they shouldn't be treated like hard fact.
Data Depth
In day-to-day use, the tech stack can matter more than the revenue estimate. App detection tends to land around 70% to 85% accuracy, and the apps a store uses can say a lot about its size and setup.
| App Detected | What It Signals | Typical Revenue Signal |
|---|---|---|
| Klaviyo | Serious email program | $20k+/month |
| Gorgias | Dedicated support team | $50k+/month |
| Rebuy | AOV optimization focus | $100k+/month |
| Shopify Plus | Enterprise-level needs | $500k+/month |
A store's app mix can tell a story fast. If you see Klaviyo, Gorgias, and Rebuy together, that's usually not a tiny side project.
Agency Fit
Extensions are a good fit for single-lead vetting and pitch-building. They're not the right tool for list building.
Where they shine is in finding gaps in a store's stack. For example:
- A high-traffic store with no email marketing app
- A store with weak or missing reviews tools
- A growing brand that hasn't added support or upsell apps yet
Those gaps can turn into a direct pitch angle.
Pricing is easy to get into. Koala Inspector offers a free tier, and its Pro plan costs $9.99/month. Store Inspector is free. That makes these tools useful for quick lead checks and pitch prep, but not for building large revenue-filtered lists.
When you need market-level signals instead of one-store checks, traffic intelligence platforms are the next step.
3. Traffic Intelligence Platforms
Browser extensions are handy when you want to check one store at a time. But if you're trying to rank a lot of stores at scale, traffic platforms do a much better job.
Tools like SimilarWeb and SEMrush pull data from ISP partnerships, clickstream panels, and web crawls to model traffic across many stores at once. From there, they estimate revenue using traffic, conversion rate, and AOV. And they don't use one flat conversion rate for every store. They lean on category benchmarks instead:
- 4.9% for gifts and occasions
- 3.4% for health and wellness
- 1.5% for fashion and apparel
- 1.2% for jewelry
AOV is usually estimated from visible products, often by averaging top or hero items. That sounds reasonable on paper. But it can miss what happens in the cart. Bundles and promo offers can push actual AOV 30–40% higher than what the catalog shows, which pulls the estimate down.
Accuracy for Prospecting
These tools tend to be most dependable once a store passes 100,000 monthly visits. Below that point, the sample can get thin, and estimates may miss by 30–50%. For larger stores, they can come within 15–25% of actual revenue. It's still a model, not a bank statement, but that's often close enough to sort a prospect list.
One catch: traffic tools can skew high for fast-growing DTC stores because their panels over-index on stores that are more digitally mature. A smarter starting point is the midpoint between two tools, like SimilarWeb and SEMrush.
Data Depth
Traffic platforms also help you look past the top-line estimate. You can break down traffic sources and review ad activity, including active ad counts, creative variety, and how long ads have been running. Ads that stay live for 60+ days are a strong signal that the campaign is making money.
That matters in practice. A store with average traffic but long-running ads may be a better outreach target than a store with bigger traffic and weak ad staying power.
Agency Fit
Traffic tools tend to work best in the 10,000–50,000 monthly visitor range, where revenue often lands around $50,000–$250,000/month and decision cycles are still short. That's a useful zone for agencies that need enough signal to qualify accounts without getting stuck in drawn-out sales cycles.
They do have blind spots. These platforms can undercount stores that lean hard on email or SMS, and they can undervalue seasonal brands. When the traffic picture is too thin or too warped, manual revenue calculators are often the better fallback.
4. Manual Revenue Calculators
When traffic data is thin, manual calculators help fill the gap. They estimate revenue from public inputs with a simple formula: traffic × conversion rate × AOV. In plain English, you take estimated traffic, apply a category conversion benchmark, and multiply by the visible average order value to get a monthly revenue estimate.
Here’s what that looks like in practice. A fashion store with 100,000 monthly visitors, a 1.5% CVR, and a $65 AOV comes out to about $97,500 per month. Simple enough. The catch is that category benchmarks can swing a lot. Gifts & Occasions may convert at 4.9%, while Jewelry might sit around 1.2%. So if you use one flat average for every store, the math can drift fast because buying behavior changes a lot by niche. That’s why this method is useful, but not complete.
Accuracy for Prospecting
Manual estimates are directional, not precise. Traffic-based methods are about 40–60% accurate, and traffic estimates can be off by 30–50% for sites with fewer than 100,000 monthly visits. That’s a pretty big margin.
The formula also leaves out parts of the business that matter. It misses repeat purchases and email/SMS revenue, even though those channels can drive 40–60% of total revenue. It also skips refund rates, wholesale orders, and subscription revenue. Because of that, tech stack signals can be a good reality check before you trust the number too much.
Data Depth
Manual calculators only use what’s public. That usually means:
- Product pricing
- Catalog size
- Third-party traffic data
That gives you a surface-level read, not a full sales picture.
Agency Fit
For agencies, manual calculators are best for revenue bands, not exact figures. If you can tell a store is likely in the $50,000–$250,000/month range, that’s often enough for lead qualification and prioritization.
It also helps to compare stores inside the same niche instead of chasing exact monthly numbers across very different categories. A fashion brand and a jewelry store may get similar traffic, but their conversion patterns can look nothing alike. In practice, the choice comes down to one thing: do you just need rough screening, or do you need first-party data?
5. First-Party Shopify Analytics
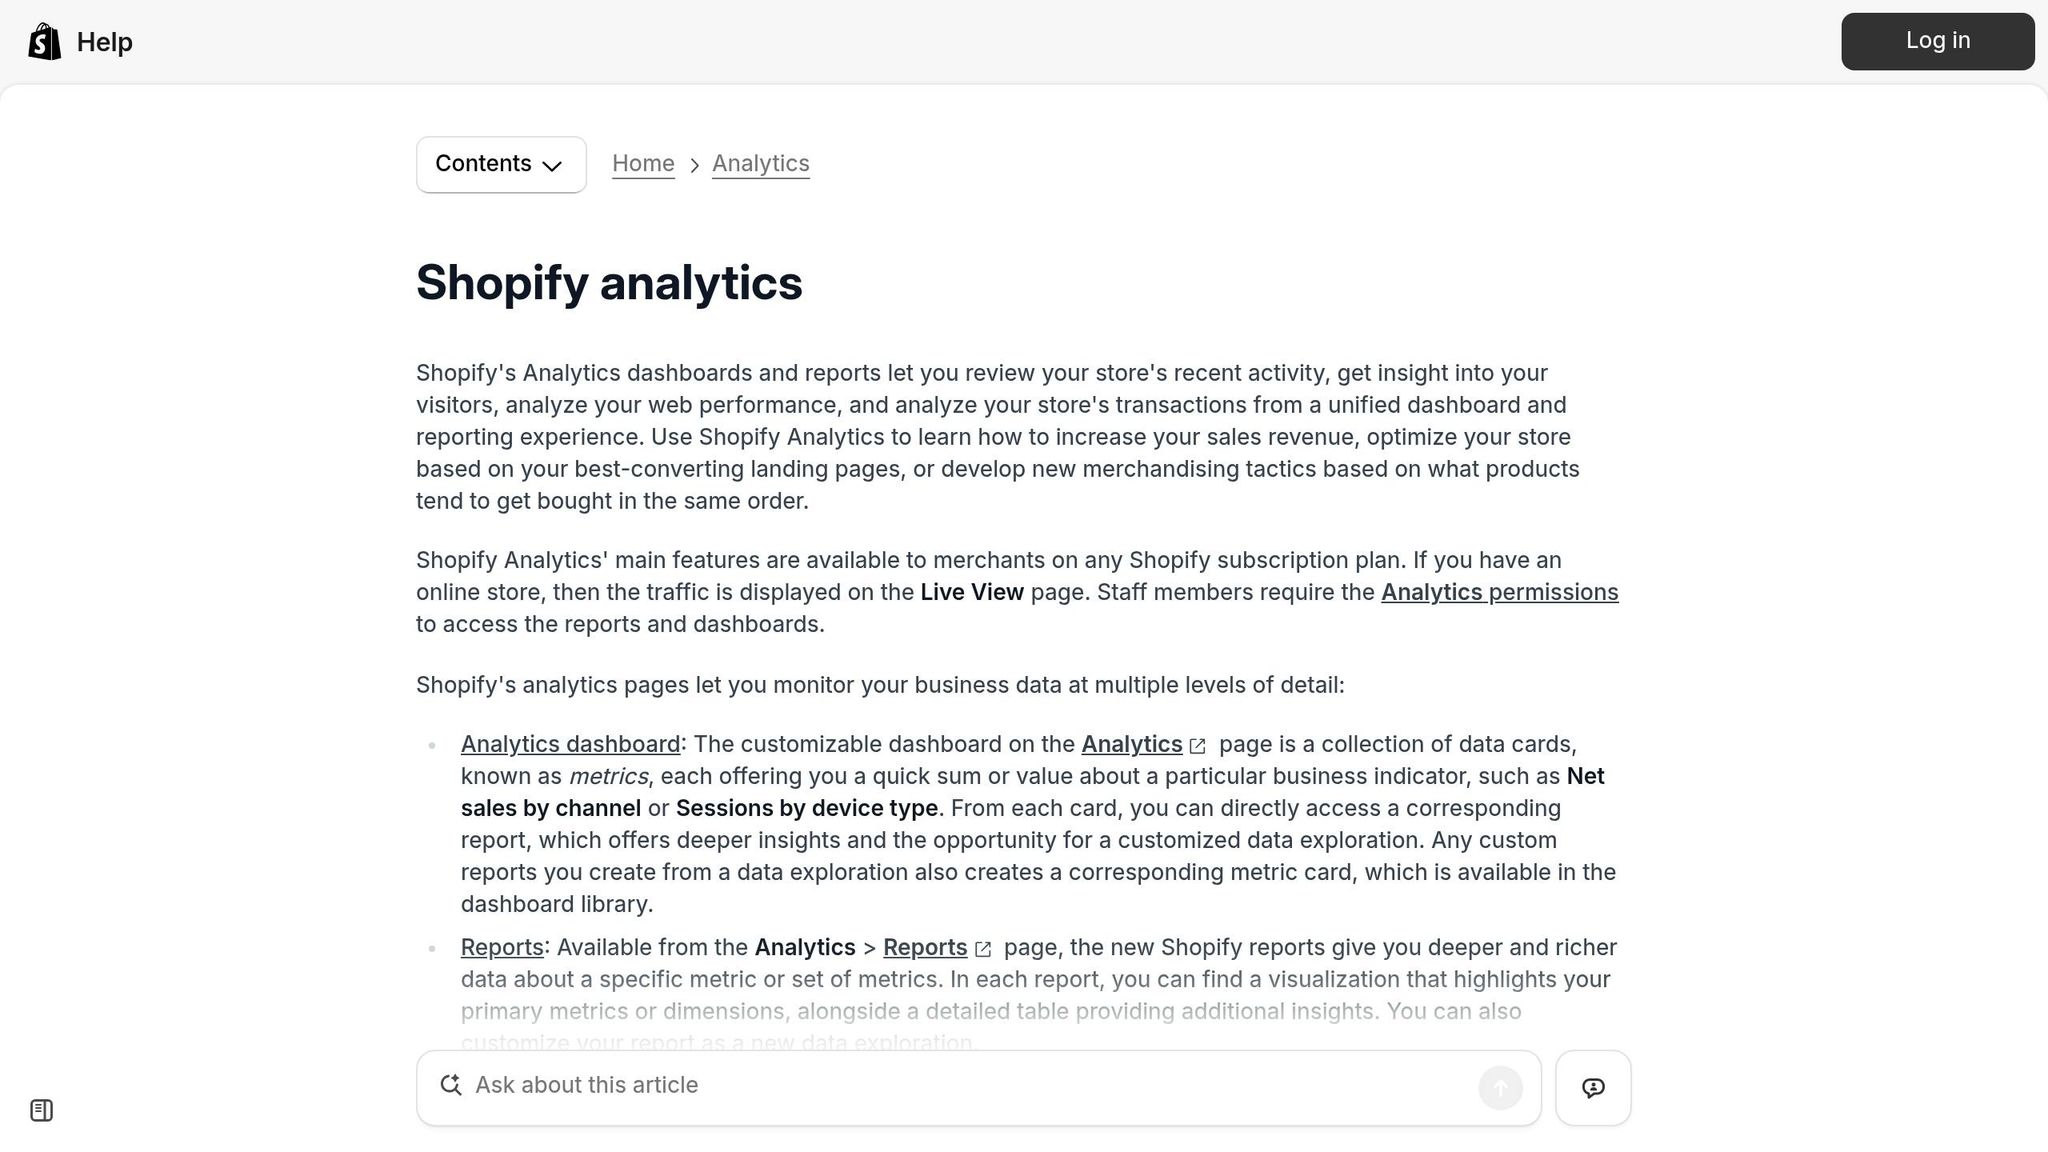
Shopify Analytics is the ground-truth benchmark in this comparison because it reports actual revenue. Put simply, when other tools estimate, Shopify confirms. It pulls in orders, refunds, and discounts in real time from the store’s private transaction data. That’s why it’s the accuracy benchmark for every outside estimator covered here.
Estimation Method
Shopify Analytics uses data pulled straight from the Shopify admin database. The clearest historical view is Sales over time in Shopify Admin → Analytics → Reports, which shows revenue, order volume, and AOV for the date range you choose.
Accuracy for Prospecting
For prospecting, first-party analytics is basically unusable because the data is private. Only the store owner or authorized staff can get into the Shopify Admin dashboard. So yes, it’s 100% accurate for the merchant, but if you’re on the outside doing competitive research, you can’t use it.
Data Depth
Shopify Analytics breaks revenue out by channel using last-click attribution across a 30-day window. It also includes product and customer reports, such as returning customer rate. You’ll also find reports like:
- Sales by channel
- Sales by checkout
- Returns
It goes further with details on refunds and wholesale B2B orders.
There’s one catch, and it matters. Native Shopify reports can misclassify up to 75% of revenue as "Direct" traffic because the system often loses the original marketing touchpoint after 30 days. For agencies, that attribution gap can throw off channel reporting in a big way.
Agency Fit
Use first-party analytics for client reporting, not prospecting. When you compare outside estimates, line them up against Gross Sales rather than Net Sales or Profit. External tools can’t see refunds or COGS anyway.
For prospecting and outbound work, you’ll still need outside estimation tools. Access to Shopify Analytics only starts once the merchant grants admin permission.
Use this benchmark to judge where outside tools are close enough for prospecting and where they’re still just directional.
Strengths and Tradeoffs by Use Case
Use the table below to compare each tool by fit, scale, and accuracy. It gives you a quick side-by-side view of the main tradeoffs.
| Tool Type | Best Use Case | Accuracy | Scale | Contact Data? | Typical Cost |
|---|---|---|---|---|---|
| StoreCensus | Bulk prospecting, outbound | 70–85% for lead prioritization | High (6M+ stores) | Yes | $49–$599/month |
| Browser Extensions | One-store checks | 30–50% | Low (one store at a time) | No | Free–$19.99/month |
| Traffic Intelligence Platforms | Market research, benchmarking | 40–60% | Medium | No | Free tier; paid plans from $125/month |
| Manual Revenue Calculators | High-stakes validation | 70–80% with triangulation | Very low (time-intensive) | No | Free |
| First-Party Shopify Analytics | Accuracy benchmark | 100% | N/A (own store only) | N/A | Free (admin access) |
The notes below show where each method actually helps, and where it falls short.
For one-store checks, browser extensions are the fastest pick. You can look up a store in seconds. But there’s a catch: accuracy usually lands around 30–50%. That makes these tools fine for a quick read, but not something you’d want to treat as final. Good for one-off checks. Not so good for building bulk lists.
For bulk prospecting and outbound, a database makes more sense. StoreCensus lets you filter by revenue, tech stack, country, and growth signals. It also surfaces decision-maker contact information, which matters if you’re trying to move from research to outreach without extra steps.
For market research, traffic intelligence platforms are the go-to option for sizing a niche or benchmarking a category. They won’t tell you exact revenue, but they can help you spot patterns across a market.
Manual triangulation takes time, and that’s the big downside. Still, when the estimate has to hold up under scrutiny, this method is one of the strongest. Using three independent signals - traffic, ad library activity, and tech stack - can bring error down to 20–30%. Ad library activity is especially helpful here because it can confirm whether traffic and stack signals line up with actual scale.
First-party Shopify Analytics is the benchmark in this comparison. It shows actual revenue from the store itself. That’s why every outside estimator here is judged against it, not the other way around.
Next, turn these tradeoffs into a simple choice.
Which Tool Should You Use?
Choose based on scale, confidence, and data access.
After looking at accuracy and data depth, the right pick depends on the job you need done.
| Goal | Best Tool Type | Why |
|---|---|---|
| Prospecting at scale | Store database (StoreCensus) | Filter 6M+ stores by revenue, tech stack, country, and growth signals, then export decision-maker contacts |
| Single-store profiling | Browser extensions | Quickly profile one store at a time |
| Own-store reporting | First-party Shopify Analytics | Exact own-store revenue data |
| Broad agency targeting | Traffic intelligence platforms | Useful for broad benchmarking and comparing relative size and traffic sources across platforms |
| Category validation | Manual revenue calculators | Best when you know the category's conversion rate and AOV well enough to model revenue yourself |
If you're building an outbound pipeline, StoreCensus is the practical place to start. You can filter by revenue band, tech stack, and country, then turn that into a targeted list.
If you just need a fast snapshot of one store, a browser extension does the job in seconds. Just treat the revenue number as directional, not exact.
For high-stakes decisions, use more than one signal. Check traffic, tech stack, and ad library data together to get closer to ground truth. Match the tool to the job, then triangulate when the decision carries risk.
FAQs
How accurate are Shopify revenue estimates in real use?
Shopify revenue estimates rely on public signals, not private store analytics. So they’re never 100% precise.
In most cases, the margin of error lands somewhere between 20% and 50%.
The level of accuracy depends on the method used and the size of the store. Traffic-based models, for example, often swing by 30% to 50% for stores with fewer than 100,000 monthly visitors. Bigger stores with heavier traffic usually produce estimates that are a bit more dependable.
When should I trust an estimate versus verify it manually?
Use revenue estimates as a directional tool, not a precise readout. They work best for relative comparisons, like sizing up competitors or spotting shifts in the market.
Why? These tools lean on public signals such as traffic data and tech stacks. That means accuracy often lands somewhere between 30% and 70%.
For high-stakes decisions - like committing a major budget or locking in a business plan - check the numbers by hand. If you want more confidence, compare the estimate against other signals, including app investments, theme updates, and best-selling product lists.
What signals matter most when estimating a Shopify store’s revenue?
The most important signals are traffic volume, conversion rate, and average order value. Those three work together to shape revenue estimates.
Other signals can help fill in the picture too, like tech stack complexity, ad spend activity, catalog maturity, and product turnover. But there’s a catch: these signals are much more useful when you track them over time instead of relying on a single snapshot.