Shopify Speed Audit: 7 Checks Before Outreach
7-step pre-outreach audit for Shopify stores to spot LCP, image and script issues, app bloat, theme age, mobile score, and budget fit.

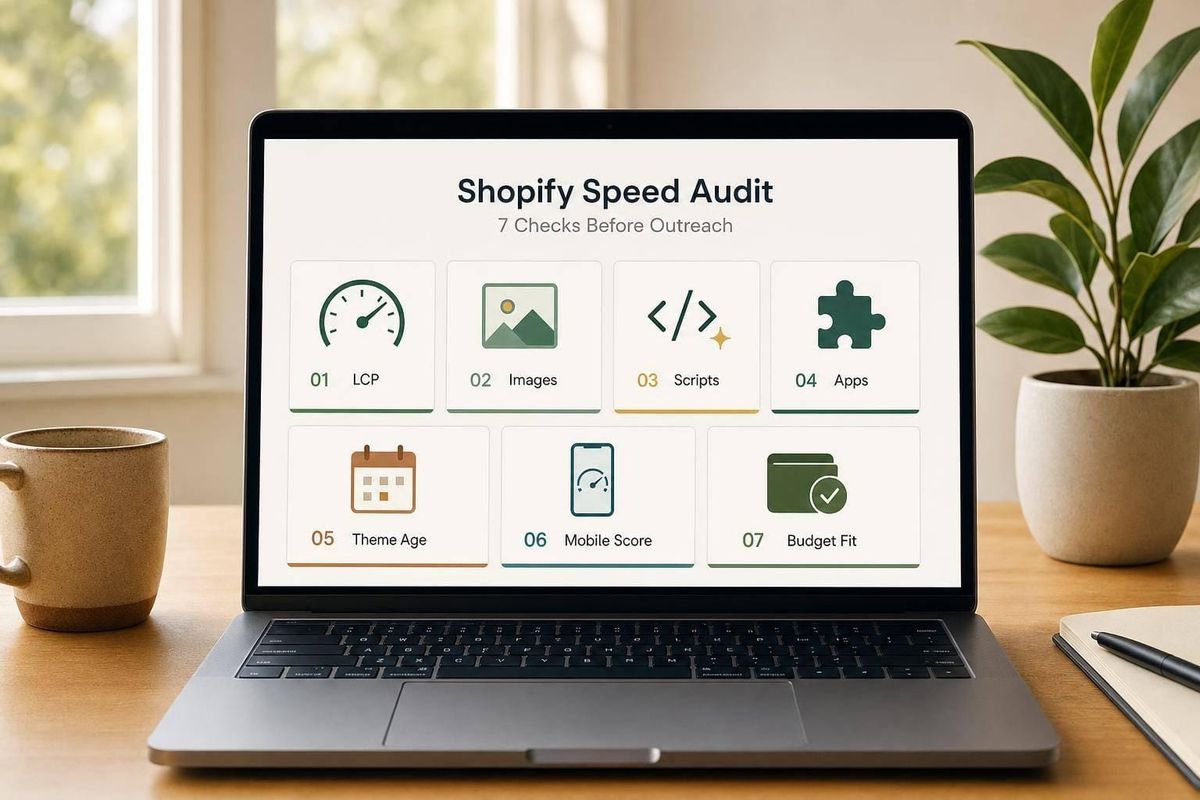
I can tell if a Shopify store is worth contacting in under an hour by checking seven speed signals first. That matters because the median Shopify store sits at about 3.8 seconds mobile LCP, above Google’s 2.5-second target, and a 1-second mobile delay can cut conversions by up to 20%.
Before I send a cold email, I look for three things:
- Is the store worth my time?
- Does it need a small fix or a larger job?
- Does it look like the merchant can support a monthly budget?
Here’s the short version of the process:
- I check homepage mobile LCP
- I review image file size
- I count JavaScript files
- I look for app bloat and leftover code
- I scan for theme age and old setup clues
- I review the mobile PageSpeed score and CLS
- I match the findings to traffic, theme tier, and budget signals
The point is simple: I use speed as a sales filter, not just a dev metric. A store with high traffic, poor Core Web Vitals, and too many apps gets one type of pitch. A low-traffic store with an old theme and weak buying signals may not be worth contact at all.
If I do this work first, my outreach is sharper, more personal, and far less random. This approach is a core part of how I find and target Shopify stores that are actually ready to buy.
How to Audit Your Shopify Store Speed (and Fix It in 4 Steps)
sbb-itb-61169e3
The 7 checks to run on every Shopify prospect
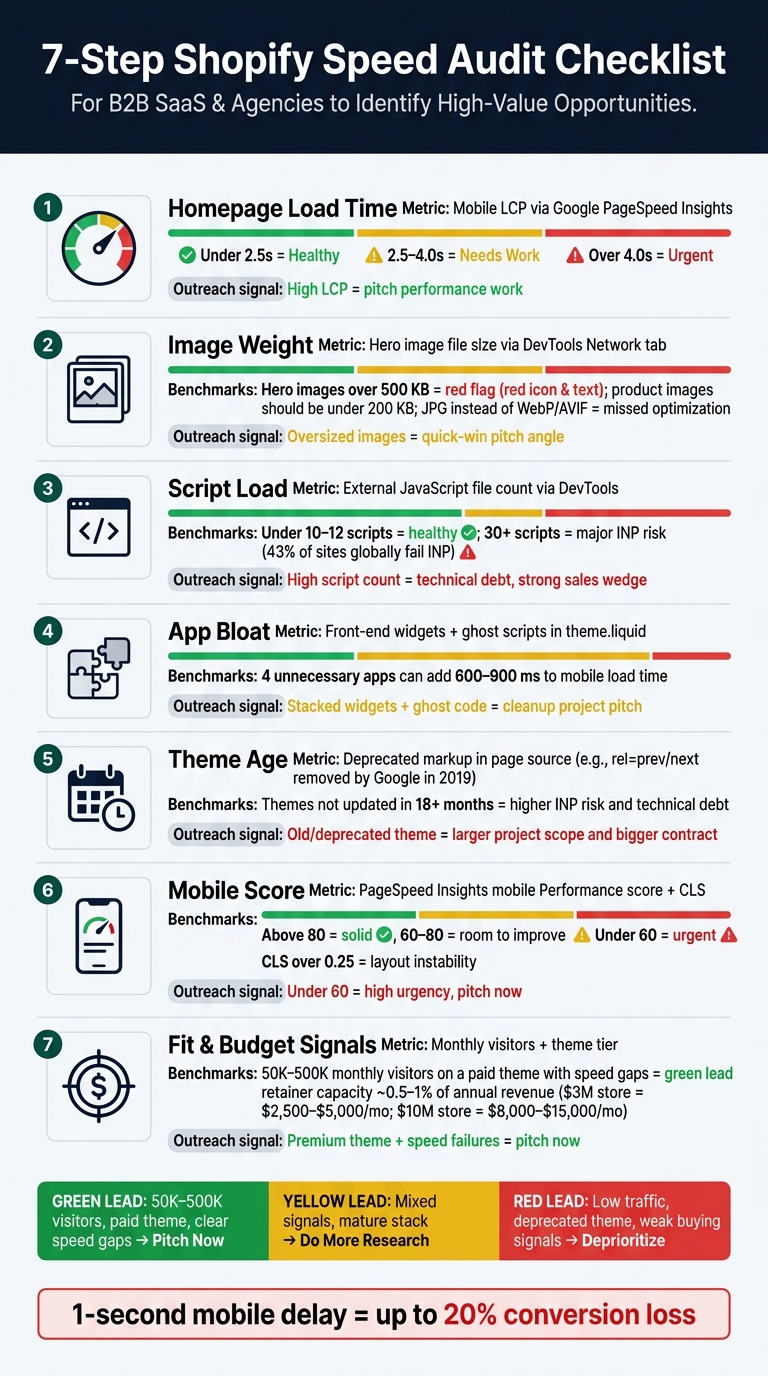
7-Step Shopify Speed Audit: From Check to Outreach Decision
Start with the homepage. Then do a quick spot check on one collection page and one product page. That gives you a solid read on how the store is doing without turning this into a full audit.
Check 1: Homepage load time
Open Google PageSpeed Insights and test the prospect’s homepage URL on the mobile tab. Focus on mobile Largest Contentful Paint (LCP), which measures how long the biggest visible element takes to load. If TTFB is above 800 ms, getting LCP below 2.5 seconds usually takes backend work too [1].
Here’s a simple way to grade it:
- Under 2.5 seconds: healthy
- 2.5–4.0 seconds: needs work, strong outreach angle
- Over 4.0 seconds: serious problem, high urgency
"The median Shopify store has an LCP of approximately 3.8 seconds on mobile - squarely in the 'needs improvement' range where Google begins applying ranking pressure." - Dan, Lead Store Performance & RUM Engineer, Superspeed [1]
Check 2: Image weight
Open the homepage in an incognito window. Then go to DevTools > Network, filter by images, and sort by file size. Check the hero image first, along with any large banner images.
Hero images over 500 KB are one of the most common easy fixes [4]. Individual product images should stay under 200 KB [2][7]. Also look at the file format. If you see large JPGs where WebP or AVIF should be, that usually means image optimization hasn’t been touched.
This check tells you a lot fast. A few heavy images often point to a quick fix. Heavy images all over the page usually mean there’s a bigger content workflow issue behind the scenes.
Check 3: Script load
Stay in DevTools, open the Network tab, and filter by JavaScript. Count the external scripts on the homepage. You can also right-click, view source, and search for <script> if you want a rough count.
A healthy storefront usually loads fewer than 10–12 total scripts, including analytics, marketing tags, and widgets [1]. If a store has 30 or more external scripts, that’s a major warning sign for Interaction to Next Paint (INP) problems. INP replaced First Input Delay as a Core Web Vital in March 2024 [6][7]. And this isn’t some edge case: about 43% of sites globally fail INP [7].
Heavy or render-blocking JavaScript can also point to poor implementation, not just too many apps.
Check 4: App bloat
Look at the live storefront and scan for stacked widgets like live chat, loyalty popups, review stars, and cookie banners. Each one usually adds its own JavaScript.
But the bigger problem is often ghost scripts. That’s code left behind by apps that were removed but never cleaned out of theme.liquid. The app is gone, but the code still loads on every visit and slows the site down for no reason. Removing just 4 unnecessary apps can cut mobile load time by 600–900 ms [4].
If the homepage has multiple overlapping widgets, that’s usually a clear sign the store is loading too many front-end apps.
Check 5: Theme age
Check the page source for signs of an old setup. Deprecated markup like <link rel="prev/next"> is a strong clue. Google removed that from its guidelines in 2019 [6]. Heavily customized themes with deep Liquid nesting can also signal technical debt.
Themes that haven’t been updated in over 18 months are more likely to miss modern metrics, especially INP [6]. That doesn’t always make it a bad lead. In many cases, it means a bigger project scope and a larger contract.
Check 6: Mobile score
Go back to PageSpeed Insights and look at the mobile Performance score. This matters because mobile traffic usually makes up 70%+ of ecommerce visits [2][1], and Google uses mobile-first indexing.
A simple benchmark:
- Above 80: solid baseline
- 60–80: room to improve, worth pitching
- Under 60: major problems, high urgency [2]
Also check Cumulative Layout Shift (CLS) on mobile. If CLS is over 0.25, elements are moving around while the page loads. That makes the site feel sloppy and frustrating to use. This score helps you judge whether the store needs a small fix or a larger rebuild.
Check 7: Fit and budget signals
After the first six checks, use what you found to qualify the lead.
Stores running paid ads with an LCP over 4.0 seconds are burning ad spend on slow landing pages [1][5]. Merchants with a mature stack that still fail speed tests often have the budget for deeper optimization work [5]. At that point, the first six checks should make the path pretty clear: pitch a quick fix, pitch a broader optimization project, or skip outreach.
How to read the results before you pitch
Once you’ve finished checks 1–7, score the prospect. What matters most is the pattern across the metrics, not one number in isolation. Use the seven checks to sort prospects by urgency. Then look at traffic and theme signals to get a read on budget.
Green, yellow, and red lead categories
It helps to think in three tiers.
Green leads are stores with 50,000–500,000 monthly visitors, a paid theme, and clear speed gaps. These are the ones to pitch now. They’re already putting money into the brand, but they still have a problem worth fixing [3].
Yellow leads send mixed signals. Traffic may be decent, but the stack is already mature or the speed issue doesn’t look urgent. In that case, consult store prospecting guides before reaching out [5][8].
Red leads are stores with very low traffic, deprecated themes, or weak buying signals. These usually go to the bottom of the pile. The revenue upside is lower, and the sales cycle is often longer than the effort is worth [3][8].
What each signal says about budget
Priority tells you who to contact first. Budget signals tell you how big the project might be.
For example, a store using a premium theme with 200,000+ monthly visitors that still fails Core Web Vitals is a strong budget signal. They’ve already spent on design, and a slow site is probably costing them money. Google’s own research shows that a 1-second delay in mobile load time can cut conversions by up to 20% [4].
That kind of pain tends to shorten the sales cycle.
As a rough benchmark, retainer capacity often lands around 0.5%–1% of annual revenue [8]. So a $3 million store may fit in the $2,500–$5,000/month range, while a $10 million store may fit in the $8,000–$15,000/month range. Use traffic and theme tier to estimate where the prospect sits before you put a number in front of them.
Summary table: 7 checks, benchmarks, and outreach decisions
Use this table to go from audit result to outreach decision in one pass.
| Check | Metric to Review | Benchmark | Outreach Decision |
|---|---|---|---|
| 1. Homepage Load | Mobile LCP | Under 2.5s healthy; over 4.0s urgent [4] | High LCP = pitch performance work |
| 2. Image Weight | Main image size | Under 200 KB [2] | Oversized images = quick-win angle |
| 3. Script Load | External scripts | 30+ scripts = INP risk [1][7] | High count = technical debt, strong wedge |
| 4. App Bloat | Front-end apps + ghost scripts | 4 unnecessary apps can add 600–900 ms [4] | Stacked widgets = cleanup project |
| 5. Theme Age | OS 2.0 vs. deprecated theme | Deprecated theme = red flag [3] | Old theme = larger project scope |
| 6. Mobile Score | PageSpeed Insights mobile score | Above 60 solid; under 60 urgent [2] | Under 60 = high urgency, pitch now |
| 7. Fit & Budget | Monthly visitors + theme tier | 50K–500K visitors is best fit [3] | Premium theme + speed failures = green lead |
How to make this audit part of your prospecting workflow
Build a pre-outreach research pass
After you score a store, bring those seven checks into your CRM. Make the audit a required step before every cold email, sales call, or Loom audit.
Set up one CRM field for each of the seven checks. Then, when a rep pulls in a new prospect, they fill out those fields before the account can move to "ready to contact." That gives your team one shared way to qualify leads instead of having everyone wing it.
Those fields also help you decide who should get outreach first. And they make personalization much easier. When the audit data sits inside your CRM, reps can write opening lines that fit the store in front of them. A store running a deprecated theme with strong traffic should get a different intro than a store on Dawn with a clean mobile score.
Use StoreCensus to narrow the list first
Next, use StoreCensus to trim the list before reps spend time on manual review. Don't audit every store by hand.
StoreCensus lets you filter by revenue, tech stack, theme, country, and growth signals. That helps you surface stores that already show the kinds of conditions that often point to speed issues before you run a single check. In plain English: start with a filtered list that already matches your ICP, then audit that list.
You can also use store-change alerts to time outreach around theme swaps or new app installs.
Conclusion: Use speed as a sales filter, not just a technical metric
After you score the seven checks, use speed to sort the account before you reach out. Use those checks to place prospects into now, later, or not at all.
This framework is a sales filter, not a technical audit. That matters because it gives reps a repeatable way to pick the right pitch. It also creates a shared standard for qualifying leads instead of leaning on gut feel.
Read the pattern first. Then match the pitch to the problem.
Speed can point to budget. Deprecated themes, heavy scripts, and weak mobile scores can hint at a rebuild, optimization work, or urgency. A weak mobile score on a high-traffic store signals urgency. A store with high traffic, poor Core Web Vitals, and app bloat calls for a different conversation than a store with low traffic and no active growth signals.
Start with the signals. Then pitch the right fix.
FAQs
How long should this audit take per store?
For a pre-outreach speed audit, set aside about 40 minutes per store.
That’s much leaner than a broad technical SEO audit, which can take 90 minutes or even 2 to 4 hours. This 7-point review is built to stay tight and tactical.
The goal is simple: move fast, spot the big issues, and get a clear read on whether the store is a fit. In that short window, you can check things like homepage load time, image weight, and app bloat.
That gives you a quick sense of two things:
- where the store may need help
- whether there’s likely budget fit
It’s not meant to be a deep site-wide teardown. It’s a focused first pass that helps you size up the opportunity without sinking too much time into each store.
Which speed issues are the fastest to fix?
The fastest fixes are usually unused apps and media optimization.
Apps that no longer bring in revenue often add render-blocking JavaScript. Remove them, and your store can load with less friction.
Images are another easy place to start. Resize oversized files to match the way they actually appear on the page, such as 1,200 pixels wide. You can also preload hero images to get them on screen sooner.
Those two changes are often quick wins for Largest Contentful Paint and Core Web Vitals.
How do I tell if a slow store can afford help?
Check budget signals before you make your pitch. A few signs stand out: Shopify Plus status, which usually starts at $2,000+/month, paid themes, and stores that are already paying for several apps.
Traffic helps too. Stores with 50,000+ monthly visitors are often the best fit for most agencies. If a store is below about 10,000 visitors, a $2,000+/month retainer is usually a harder sell.
The big idea is simple: focus on stores that are already spending money to grow.