Sales Reporting Automation for Shopify Agencies
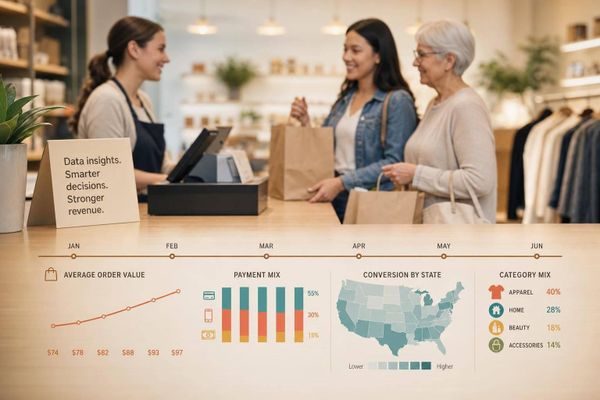
Standardize metrics, automate Shopify data flows, and enforce QA to save hours on client reporting with lean or BigQuery stacks.

If I had to boil this down to one point, it’s this: I standardize metrics first, then automate data pulls, then lock in QA. That order is what stops Shopify agency reports from turning into a mess of mismatched numbers and manual cleanup.
Here’s the short version:
- Manual reporting burns time fast - often 4 to 8 hours per client per month and up to 208 hours per year for weekly CSV work.
- Two reporting tracks matter - my agency sales data and each client store’s sales data.
- The biggest problem is not the tool - it’s teams using different definitions for things like revenue, net sales, and attribution.
- Shopify should own store transaction data, while CRM and finance systems should own pipeline and booked revenue.
- A lean stack usually means Shopify + Zapier or n8n + Google Sheets.
- A larger stack usually means Shopify + BigQuery + Looker Studio once Sheets gets slow or joins get messy.
- The first workflows I’d automate are:
- Shopify to spreadsheet/dashboard
- Shopify to CRM
- StoreCensus to CRM
- Data rules matter - especially for timezone settings, duplicate webhook events, UTM naming, and weekly QA checks.
Shopify Analytics Reporting Automation via Big Query with Gabriel Freeman

sbb-itb-61169e3
Quick Comparison
| Area | What I focus on | Main goal |
|---|---|---|
| Agency reporting | Pipeline, win rate, MRR, closed revenue | Track sales performance |
| Client-store reporting | Net sales, orders, refunds, AOV, channels | Track store performance |
| Lean setup | Sheets + sync tool | Lower effort, easier upkeep |
| Advanced setup | BigQuery + BI dashboard | Better for more stores and more data |
| First automation wins | Shopify reporting workflows | Cut repeat manual work |
| Governance | KPI rules, dedupe, QA, access control | Keep reports accurate |
Put simply, I’d start with one internal sales dashboard, one client report template, and one segmented pipeline report. If those three stay accurate week after week, the rest gets much easier to scale.
The metrics and data sources to standardize before you automate
Standardize metrics first. Then automate. Once the definitions are locked, pick the lightest setup that can pull the numbers and send them where they need to go.
Core agency sales metrics for Shopify service businesses
Track two buckets: pipeline health and booked revenue.
On the booked revenue side, focus on closed-won deals, retainer MRR, and project-based revenue. Those numbers tell you what’s already sold.
For pipeline health, watch win rate, average deal value, sales cycle length, pipeline coverage, and forecast accuracy. Those show whether the pipeline is strong enough to hit next quarter’s targets.
Pipeline metrics should live in your CRM. Revenue metrics should match your accounting system. If the CRM says one number for closed-won revenue and finance says another, stop there and fix the process before you automate anything.
Client and merchant performance metrics worth tracking
At the client-store level, standardize your merchant metrics next. A solid reporting set includes net sales, total orders, refunds, discounts, AOV, conversion rate, sales by product, and sales by channel.
Define net sales the same way in every client report: gross sales minus refunds minus discounts. That sounds simple, but it trips teams up all the time. If one account manager reports gross sales and another reports net sales, your roll-up numbers won’t match. It’s like adding apples and oranges, then wondering why the total looks off.
Two areas cause trouble again and again: attribution windows and timezones. Pick one attribution model, such as last-non-direct, and use it across every report. Then make sure every source uses the same date range and timezone. If you don’t, daily totals can drift by 1.5% to 2%.
Where each metric should come from
The table below shows the source of truth for each metric group and why it should own that number.
| Metric Category | Source of Truth | Why |
|---|---|---|
| Agency pipeline & revenue | CRM / Finance records | Tracks deal stages, win rates, and actual closed revenue |
| Merchant sales & orders | Shopify Admin/API | Accurate transactional records at the store level |
| Traffic & conversion behavior | GA4 / First-party pixels | Behavioral and funnel data |
| Blended KPIs (CAC, LTV:CAC) | Calculation layer (Sheets or warehouse) | Neutral ground for cross-source calculations |
| Merchant segmentation | StoreCensus | Revenue tier, tech stack, theme, country, and growth signals |
Use StoreCensus fields like revenue tier, tech stack, theme, country, and growth signals to segment reports and CRM views. Once each metric has a single source, the reporting workflow gets much easier to automate.
How to build a reporting automation stack for a Shopify agency
Lean vs. Advanced Shopify Agency Reporting Stack: Full Comparison
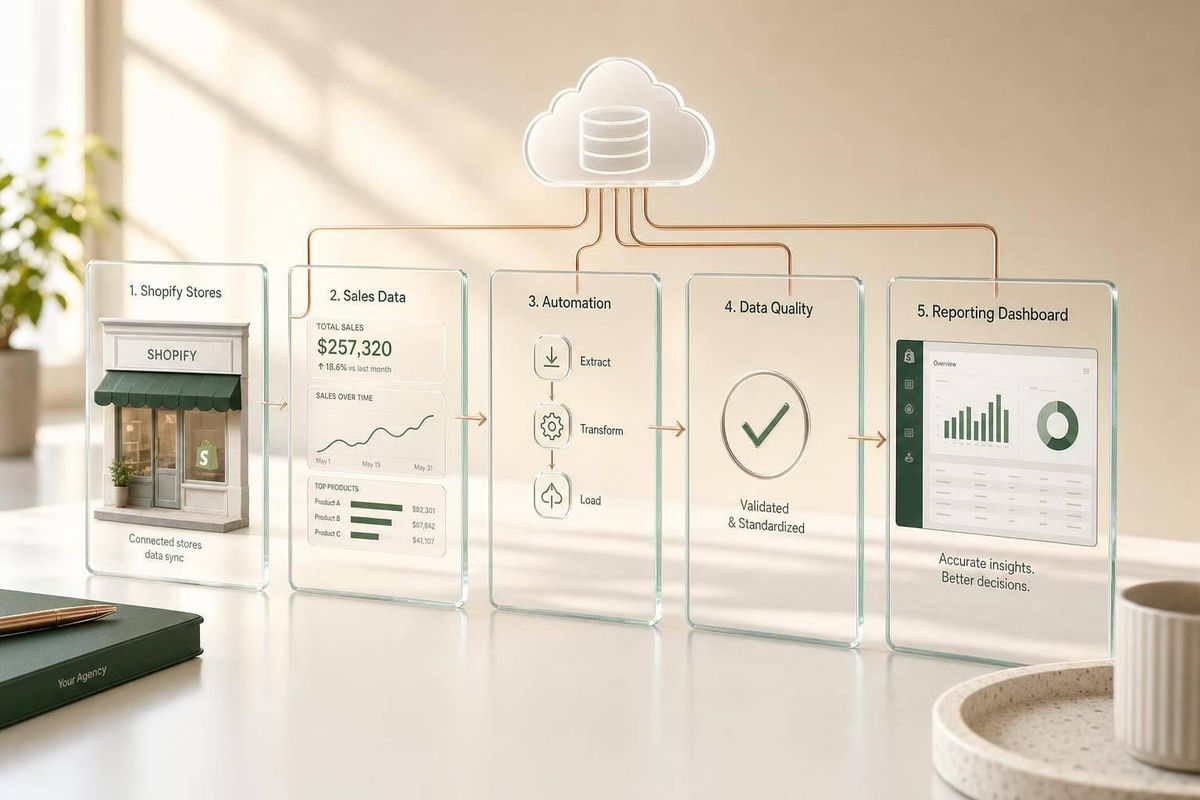
A simple reporting architecture that works for most agencies
Once your metrics and source systems are standardized, you can connect them into a simple reporting stack. Keep it to three layers: collection, consolidation, and reporting.
Use Shopify for order data, your CRM for pipeline data, and a middle layer like Google Sheets or a database to bring everything together.
Google Sheets is a solid fit for most agencies because it's free and flexible. A simple setup works well:
- Raw-data tabs for each source
- One dashboard tab that pulls everything together with formulas
If Sheets starts dragging and takes more than 5 seconds to load, or you find yourself joining more than three or four sources on a regular basis, it's time to move to BigQuery.
The automation patterns that save the most time
Once the stack is set up, the biggest time savings come from automating how data moves and how reports get sent. Manual reporting takes an average of 4 to 8 hours per client per month.
That adds up FAST. At 20 clients, you're looking at 80 to 160 hours per month. That's basically a full-time role spent on reporting alone.
Most of that time disappears when you automate three mechanical tasks: data collection, report formatting, and delivery.
For moving data, two patterns handle most agency needs. Webhooks are best when you need data right away, like order logs, inventory alerts, or fulfillment updates. Scheduled syncs work for the rest, like daily sales summaries, CRM pipeline snapshots, and weekly KPI rollups.
Send weekly reports on Monday morning so stakeholders start the week with fresh numbers.
One small gotcha can save you a headache later: Shopify webhooks can send duplicate events, so dedupe by Order ID before appending rows.
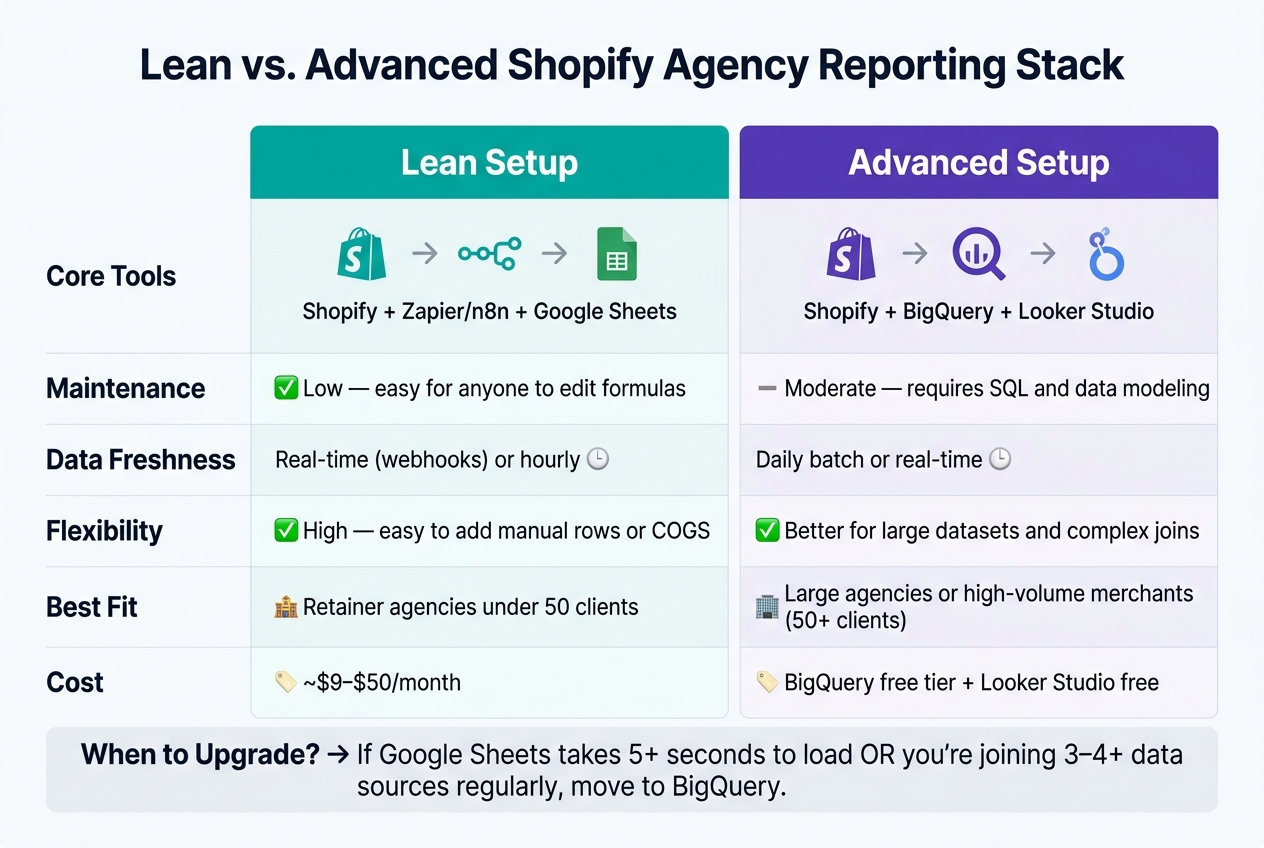
Lean setup vs. advanced setup: how to choose
| Lean Setup | Advanced Setup | |
|---|---|---|
| Core Tools | Shopify + Zapier/n8n + Google Sheets | Shopify + BigQuery + Looker Studio |
| Maintenance | Low; easy for anyone to edit formulas | Moderate; requires SQL and data modeling |
| Data Freshness | Real-time (webhooks) or hourly | Daily batch or real-time |
| Reporting Flexibility | High; easy to add manual rows or COGS | Better for large datasets and complex joins |
| Best Fit | Retainer agencies under 50 clients | Large agencies or high-volume merchants |
| Estimated Cost | About $9 to $50/month, depending on the automation tool | BigQuery free tier; Looker Studio is free |
A lean setup usually makes sense if you're running a retainer agency with fewer than 50 clients and want something simple to manage. An advanced setup starts to make more sense when data volume grows, joins get messy, and Sheets begins to feel like duct tape.
One setup detail is worth locking in early: use a dedicated automation account like automation@agency.com to own all reporting spreadsheets. If a team member leaves and their personal Google account is tied to the workflow, the whole thing can fall apart.
That choice shapes which workflows you should automate first.
Which workflows to automate first
Not every automation pays off the same way. For most Shopify agencies, the fastest return usually comes from recurring Shopify reporting first. After that, it makes sense to set up StoreCensus-to-CRM for segmented outreach and Shopify-to-CRM for one shared view of revenue and pipeline.
Shopify to CRM: unified revenue and pipeline reporting
Sync Shopify orders into your CRM so closed revenue lands on the right deal. A common setup is to trigger from Shopify’s Order Paid event, then send revenue fields to the related CRM deal. That way, pipeline and closed revenue sit in the same place instead of living in two separate systems.
Once that field mapping is stable, those same rules can also support client reporting and audience segmentation.
Shopify to spreadsheet or dashboard: recurring client reporting
This is usually the workflow with the fastest payback.
Manual Shopify-to-Sheets exports often take 15–30 minutes per report, and keeping just five weekly reports up to date can eat up 120+ hours per year. That’s a lot of time spent doing the same task over and over.
A scheduled sync fixes that. Pull the prior week’s orders into a raw-data tab, then let the dashboard handle KPI calculations on its own. A simple reporting setup usually works best at three levels:
- A daily operational view for the team
- A weekly email summary for account managers
- A monthly PDF or Looker report for client reviews
That gives each group the level of detail they need without making anyone dig through exports by hand.
StoreCensus to CRM: segmented sales reporting
The first two workflows make reporting better for current clients. This one helps with future clients.
StoreCensus lets you filter merchants by revenue tier, tech stack, theme, and growth signals like recent app installs or theme changes. When a merchant in your target segment hits one of those signals, you can send them into your CRM as a new lead automatically.
The main reporting gain here is at the segment level. If your CRM tags leads by merchant profile - for example, Shopify Plus stores using a certain loyalty app - you can report on win rate by segment, average deal size by revenue tier, and pipeline value by merchant type.
That shifts sales reporting from a flat deal list to something much more useful: a view of which merchant groups convert best and where your team should spend time next quarter.
These workflows create the inputs for reporting, but data quality rules decide whether the numbers stay clean as volume grows.
Here’s how the three workflows stack up:
| Workflow | Complexity | Freshness | Reporting Value |
|---|---|---|---|
| Shopify to CRM | Medium | Real-time | High - unified revenue and pipeline visibility |
| Shopify to Spreadsheet/Dashboard | Low–Medium | Scheduled | High - recovers the most reporting time |
| StoreCensus to CRM | Low | Real-time (signals) | Very High - segment win rate, deal size, and pipeline by merchant type |
Before you scale any of them, lock down field mapping, ownership, and deduping rules.
Data quality, governance, and scaling across more clients
Automation only helps if the data going into it stays clean. Once you manage more accounts, small reporting mistakes stack up fast. That’s why these controls matter so much. They protect the source-of-truth model you already set up.
The data issues that break automated reports
The usual problems are timezone drift, attribution mismatches, naming inconsistencies, and duplicate orders or broken syncs. Even a small date-boundary gap can throw off daily totals. So every client-facing report should use one timezone, and that setup needs to stay the same across tools.
Use Blended ROAS (total Shopify revenue / total ad spend) as the main paid-media truth metric.
Naming issues can quietly wreck filters. If product names, UTM source/medium values, or store names aren’t standardized, one client can end up split across multiple rows in a segment report. The fix is simple: use one naming convention across the team.
Use MM/DD/YYYY dates, 12-hour time, and $1,234.56 currency formatting in every client report.
The rules that keep reports accurate over time
Agencies that scale reporting well tend to follow the same few rules. They define KPIs once and lock them, assign clear data ownership, and run a weekly QA check before reports go out.
Lock your KPI definitions early. “Net Sales” and “Contribution Margin” need to mean the same thing in every client account. If team members use different formulas, the numbers drift apart.
A weekly QA pass catches most problems before a client ever sees them. Cross-check Shopify order exports against dashboard metric cards, scan for refund anomalies, and verify that UTM taxonomy stays consistent across active campaigns. As teams get bigger, some agencies add automated nightly QA checks and variance alerts.
Permissions start to matter more as more people touch reports. Shared admin access may work for a lean team. But once several people are editing dashboards, tighter access controls help stop accidental edits to pinned reports.
| Data Quality Problem | Mitigation Step |
|---|---|
| Attribution overlap | Use Blended ROAS (Total Shopify Revenue / Total Ad Spend) as the primary truth metric |
| Timezone drift | Standardize reporting to a single timezone (e.g., UTC or Store Local) |
| Naming inconsistencies | Enforce UTM source/medium consistency and product/store name mapping |
| Duplicate orders or broken syncs | Cross-check Shopify order exports against dashboard metric cards |
| Silent Shopify UI changes | Maintain a mirror dashboard in Google Sheets or a BI tool outside Shopify |
As the client roster grows, governance starts to matter just as much as automation.
| Governance Practice | Small Agency (1–5 Clients) | Large Agency (10+ Clients) |
|---|---|---|
| Permissions | Shared admin access or a single owner | Role-based access by department (Finance, Growth, Ops) |
| QA cadence | Manual weekly review | Automated nightly QA with variance alerts |
| Data architecture | Native Shopify dashboards + Google Sheets | Centralized data warehouse + BI dashboards |
| Naming conventions | Client-specific and inconsistent | Agency-wide taxonomy for UTMs and store names |
| Reporting delivery | Manual CSV exports and formatting | Automated report summaries |
Conclusion: the minimum reporting system to build first
Start with three assets: one internal sales dashboard, one client report template, and one segmented pipeline report. Build out from there only after those three stay accurate without manual fixes.
The sequence matters. Define your metrics first. Assign a source of truth for each one. Automate the workflows that take the most time. Standardize your report templates. Then put governance in place before you take on more accounts. Skip governance in the name of speed, and you end up with a reporting system that runs on paper but puts out numbers nobody trusts.
FAQs
When should my agency move from Google Sheets to BigQuery?
Move from Google Sheets to BigQuery when your reporting has outgrown spreadsheets. At first, Sheets can do the job. But once you’re manually exporting CSVs just to answer one-off questions, things start to bog down. The workflow gets slow, fragile, and much more likely to run into versioning mistakes as order history piles up.
It’s also time to make the switch when you need analysis across multiple sources, longer data retention beyond GA4’s 14-month window, or you’re dealing with high order volumes that make spreadsheets less dependable.
What should we standardize before automating Shopify reports?
Standardize your data foundation first to avoid reporting errors and fragmented reporting.
Use:
- Consistent UTM naming conventions, documented in a shared team sheet
- First-party tracking such as pixel-based attribution or server-side APIs
- API scopes like
read_reportsandread_all_orders
This helps ensure complete conversion and financial data, including refunds and surcharges.
How do we prevent duplicate or mismatched sales data?
Standardize your tracking setup so your data stays consistent across sources. That means using the same UTM naming rules across every marketing channel and documenting them in a shared team sheet.
If one team uses paid-social and another uses paidsocial, your reporting gets messy fast. A simple shared sheet can save a lot of cleanup later.
When you combine browser-based pixels with server-side APIs like Meta's Conversions API or TikTok's Events API, use the same event_id for both. That helps prevent double-counting.
Server-side tracking also helps create a more consistent, auditable data model. In plain English: your data is easier to check, compare, and trust.