How Demographic Shifts Impact Store Revenue
Monitor AOV, checkout payment mix, state conversion and category mix monthly to spot demographic-driven revenue declines.

Your store can lose revenue even when your ads look fine. In many cases, the problem is simple: the buyer changed.
I’d sum up the article like this: if your customer base gets younger, earns less, moves to new states, or shifts buying channels, your numbers change fast. AOV, repeat purchase rate, discount use, checkout behavior, and conversion by state often move before total revenue drops. That means I should not wait for a bad month to check what changed.
Here’s the short version:
- Income shifts often lead to lower AOV and more discount use.
- Age shifts can make current offers, checkout flows, and retention timing miss the mark.
- Household shifts can push demand toward smaller orders and different product mixes.
- Geographic shifts can hide weak states behind strong ones in blended reports.
- Channel shifts can make attribution messy, especially when buyers come through tools like ChatGPT Shopping or Perplexity.
- StoreCensus can help agencies sort stores by revenue, region, stack, and growth signals using our Shopify store guides so they can rank accounts and spot risk sooner.
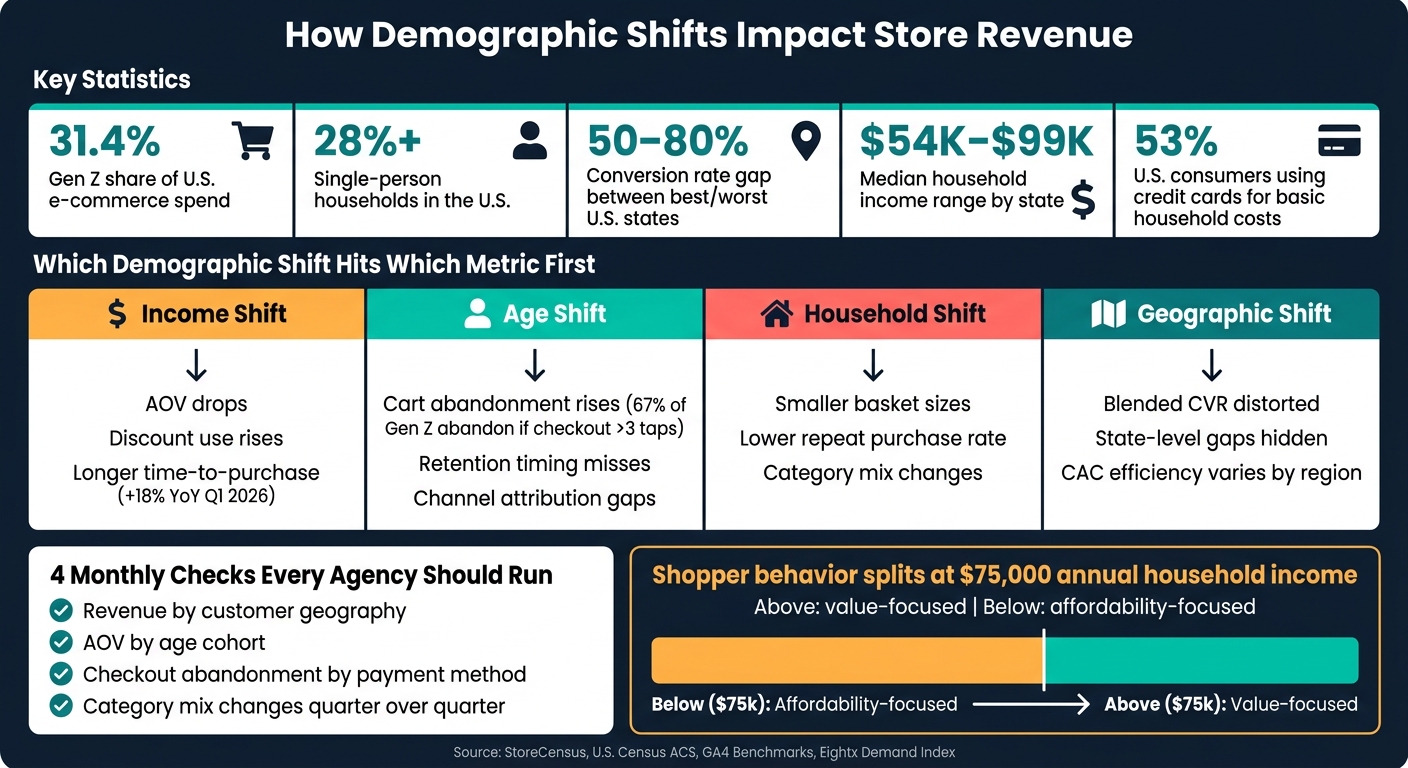
A few numbers from the article make the point clear:
- Gen Z drives 31.4% of U.S. e-commerce spend
- Single-person households make up more than 28% of the U.S. population
- State conversion gaps can range from 50% to 80%
- Median household income ranges from $54,203 to $99,858 depending on the state
- 53% of U.S. consumers use credit cards to pay for basic household costs
If I were putting this into practice, I’d review these four checks every month:
- Revenue by customer geography
- AOV by age cohort
- Checkout abandonment by payment method
- Category mix changes quarter over quarter
Bottom line: demographic change is often a revenue problem before it looks like a media problem. If you track the right store signals each month, you can spot the shift early and fix the offer, targeting, or account focus before the drop gets worse.
How Demographic Shifts Impact E-Commerce Revenue Metrics
How demographic shifts create revenue problems for stores
Demographic shifts usually show up in AOV, repeat purchase rate, and discount usage before total revenue starts to slip. That early pattern matters. In most cases, the first things to change are income, age, household makeup, and geography.
How income changes lower AOV and increase discount dependence
Income is often the first shift agencies spot in the data. Shopper behavior tends to split hard at the $75,000 annual household income mark. Higher-income shoppers ask about value. Lower-income shoppers ask about affordability. When a store starts pulling in more buyers from lower-income groups, AOV usually drops first, and discount use starts climbing.
By 2026, 53% of U.S. consumers are using credit cards to cover essential expenses like groceries and utilities. At the same time, time to purchase for mid-market DTC brands stretched 18% year over year in Q1 2026. Put simply, people are taking longer to decide and thinking harder before they buy. If the customer mix moves down-market, lower order values and heavier discount use are often the direct result. Creative testing alone won't solve a pricing issue.
How age and household changes make the current offer less relevant
When the age profile of a store's buyers changes, the offer built for the old customer can start to miss. Product mix, messaging, and retention flows may still be aimed at the prior core buyer, even though that person is no longer driving growth. Gen Z now accounts for 31.4% of total U.S. e-commerce spend, ahead of Millennials at 29.8% as of June 2026. Brands run into trouble when their retention setup still assumes Millennial behavior. Gen Z doesn't react to the same channels or the same timing, so engagement can fall well before revenue does.
Household makeup adds pressure here too. Single-person households now account for more than 28% of the U.S. population. That tends to shift demand toward smaller pack sizes and more frequent, lower-basket orders. If a store is built around family bundles, conversion and repeat purchase rate can slide as its buyer base gets younger and more likely to live alone.
How geographic and channel shifts distort performance reporting
Geography can make store performance look better - or worse - than it is. The gap in conversion rates between the best- and worst-performing U.S. states can reach 50% to 80%. So one strong state can cover up a weak one when you're only looking at blended reporting. Population growth is uneven too: Florida grew 1.4% and Texas 1.2%, while Illinois fell 0.2% and New York 0.1%. If a store has a lot of revenue tied to shrinking markets, that regional weakness can look like a campaign problem when viewed in aggregate.
Channel movement makes the picture even messier. When a customer cohort shifts from paid social to AI-assisted discovery tools like Perplexity or ChatGPT Shopping, standard GA4 attribution often fails to catch that traffic at all. Then the reporting gets muddy: performance can look weaker than it is, or the wrong channel gets the credit. Agencies need to separate actual demand changes from tracking blind spots before making calls based on performance data. These shifts tend to hit store metrics first, and revenue later.
sbb-itb-61169e3
Store signals agencies should track to spot demographic change early
Match demographic variables to the revenue metrics that move first
The fastest way to spot demographic change is to connect each shift to the metric it hits first. In most cases, the numbers move before clients say a word. That makes demographic drift an operating signal, not a postmortem.
Income shifts tend to show up in AOV and discount use. Age shifts often show up in payment mix, category mix, and mobile checkout behavior. For example, 67% of Gen Z shoppers will abandon a cart if checkout exceeds three taps on mobile. Lower credit card use among Gen Z can also point to a younger buyer mix.
Geography shifts usually appear in conversion rate by state, where the gap between top and bottom performers can reach 50% to 80%. The key is simple: track trends, not snapshots.
A monitoring table for ongoing demographic tracking
Use the table below as a monthly checklist for demographic signals.
| Data Source | Demographic Dimension | Update Frequency | Revenue Metric Affected | Agency Use Case |
|---|---|---|---|---|
| Shopify/WooCommerce Analytics | Payment method, AOV | Real-time | AOV, repeat rate | Spot shifts toward wallet-pay use or income-linked changes in basket size |
| GA4 | Geo-location, age groups, interests | Monthly | CVR by geo, revenue per visitor | Catch regional performance drift and age-based engagement shifts |
| U.S. Census / ACS | Median income, household size | Annual (September) | CAC, CPM efficiency | Compare store performance against local buying power |
| EASI Demographics | Population forecasts | Quarterly | Category mix, AOV | Adjust merchandising for aging-in-place or migration shifts |
| Eightx Demand Index | Local buying power | Annual | Blended CAC | Tier ad spend and set CPM ceilings by state or region |
Agency workflows to respond to demographic shifts using StoreCensus
The monitoring table in the previous section tells you what to watch. This section is about what to do when those numbers start to move. StoreCensus gives agencies a way to filter 6M+ stores by revenue tier, region, tech stack, theme, and growth signals, so your response to demographic change can be planned instead of rushed. Use those signals to re-rank prospects, time outreach, and flag clients before revenue starts to slide.
Rebuild your ICP around demographic revenue patterns
Start with the markets where buyer concentration is strongest, then qualify stores inside those areas. A lot of agency ICPs are built on instinct: "we work best with DTC brands doing $2M–$10M." That helps, but it misses a big piece of the picture. Geography often shapes whether a store in that revenue range can hold margin or starts losing it.
A better ICP starts with income concentration. Use StoreCensus to move high-income states to the top of your list and push lower-demand regions down.
Age mix matters too. Build that into your ICP by screening for merchants that still lack wallet support, SMS-first retention, and mobile-first checkout. Those gaps usually point to a clear problem you can diagnose and a clear way into the account.
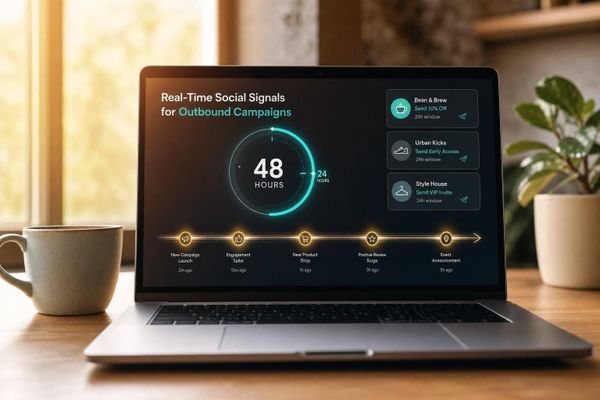
Use real-time store changes as buying signals for outreach
Stack changes often show the problem before the merchant says anything. New app installs, returns tools, and theme updates can all signal that a store is reacting to a new buyer mix.
StoreCensus surfaces those changes in real time. That timing matters. Outreach tends to work better when the merchant is already changing the stack. If you reach out around a stack change, instead of pulling from a cold list, you're stepping into a live business shift, not starting from scratch.
Score prospects and clients by demographic risk and readiness
Not every store under demographic pressure is worth chasing. The better question is simple: does this merchant see the problem, and do they have the budget and setup to do something about it?
A light scoring model can use three StoreCensus inputs:
- revenue tier
- region mapped against the DTC Demand Index
- recent tech stack or theme changes
Score first for revenue risk, then for readiness to act. High-scoring prospects usually sit in the $2M–$10M revenue band and operate in high-density demand states. They’ve also made recent stack changes that point to demographic adjustment. Low-scoring prospects tend to be in low-density regions and still depend on legacy email-only retention.
| Workflow | Demographic Signal | StoreCensus Data Used | Revenue Metric Protected/Improved |
|---|---|---|---|
| Geo-based ICP filtering | Geographic Wealth Shift | Revenue Tier + Region (Demand Index) | Blended CAC & Contribution Margin |
| Stack-change outreach | Tech Stack Modernization | App Installs (SMS, Wallets, BNPL) | Conversion Rate (CR) |
| Client risk scoring | Generational Misalignment | Theme Change + Payment Stack | Customer Lifetime Value |
Use that same score with current clients too. It helps you spot low-demand, legacy-stack accounts early and step in before performance drops.
Conclusion: Make Demographic Intelligence Part of Monthly Revenue Operations
These metrics only matter if you check them on a set schedule. Demographic shifts don’t send a warning. They usually show up first in AOV, conversion, and category mix. By the time a merchant spots the revenue drop, the shift has often been in motion for months. Top-to-bottom state conversion gaps can reach 50% to 80%. That’s not a copy issue or a media buying problem. It’s a market signal.
And those signals only help if you track them against the right source of truth. Income, age, geography, and payment behavior shape revenue in ways that are often easy to spot once you know where to look. Agencies that watch those signals early can move before the loss stacks up. Agencies that wait end up reacting after the fact.
Turn those signals into a monthly operating habit.
What Agencies Should Do Next
Use the same monthly checks to refresh StoreCensus-based prospect and client scores. Export client ZIP codes and map them to a state-level Demand Index. Then flag over-indexed states and weaker states that are pulling down blended CAC.
Build these four checks into your monthly reporting cycle:
- Revenue by customer geography
- AOV by age cohort
- Checkout abandonment by payment method
- Category mix changes quarter-over-quarter
Compare each one against local market data, not national averages. After that, update prospect and client scores with StoreCensus filters for revenue tier, state, tech stack, and growth signals.
Review geography, AOV, checkout, and category mix every month, then update your StoreCensus-based scores.
FAQs
How can I tell if a revenue dip is demographic, not ad-related?
Compare your site’s performance with broader audience metrics in GA4. If conversion rates are down across every segment, the problem is more likely tied to ads or a technical issue. But if weaker engagement or fewer conversions show up only in certain groups - like Gen Z or a specific age range - that can signal a demographic shift.
To check that, cross-reference your site data with StoreCensus revenue and growth patterns from similar stores.
Which store metrics change first when buyers shift?
The first changes usually show up in transactional metrics. These metrics reflect live buying behavior, often before you see any clear shift in demographic data.
Early signs include:
- higher cart abandonment caused by checkout friction
- shifts in product discovery, such as more social commerce or AI-search traffic
- changes in checkout conversion linked to payment preferences, including digital wallets or buy-now-pay-later
How often should I review demographic signals in my store data?
Check demographic signals often so your strategy stays in line with market shifts. Since store data changes all the time, weekly updates can help keep your data accurate.
Regular audits help you validate your ICP, confirm your target audience exists at scale, and adjust outreach based on real-time growth signals. Steady monitoring also helps you spot changes in customer behavior, spending power, and tech maturity.