
RPV vs AOV: Which Metric Finds Better Clients
Screen ecommerce stores with RPV — it reveals revenue per visitor; use AOV to identify merchandising and order-value levers.

If I had to pick one metric to screen ecommerce stores, I’d pick RPV first. It tells me how much revenue each visitor generates, not just how much buyers spend when they check out.
That matters because a store can show a high AOV and still have weak performance. A store with a $250.00 AOV and a 0.40% conversion rate makes less per visitor than a store with an $85.00 AOV and a 3.20% conversion rate. In the example from the article, that works out to $1.00 RPV vs. $2.72 RPV.
Here’s the short version:
- AOV = Total Revenue / Total Orders
- RPV = Total Revenue / Total Unique Visitors
- RPV also reflects conversion rate, because RPV = CVR × AOV
- AOV can look strong even when traffic does not convert
- RPV is better for first-pass lead screening
- AOV is better for spotting what to sell next like bundles, upsells, or free-shipping thresholds
The article’s main point is simple: RPV helps me judge store health faster, while AOV helps me find the likely growth lever. It also points out a few checks that matter before I trust either number: traffic source, mobile vs. desktop mix, new vs. repeat customers, and whether the store is using visitors or sessions as the denominator.
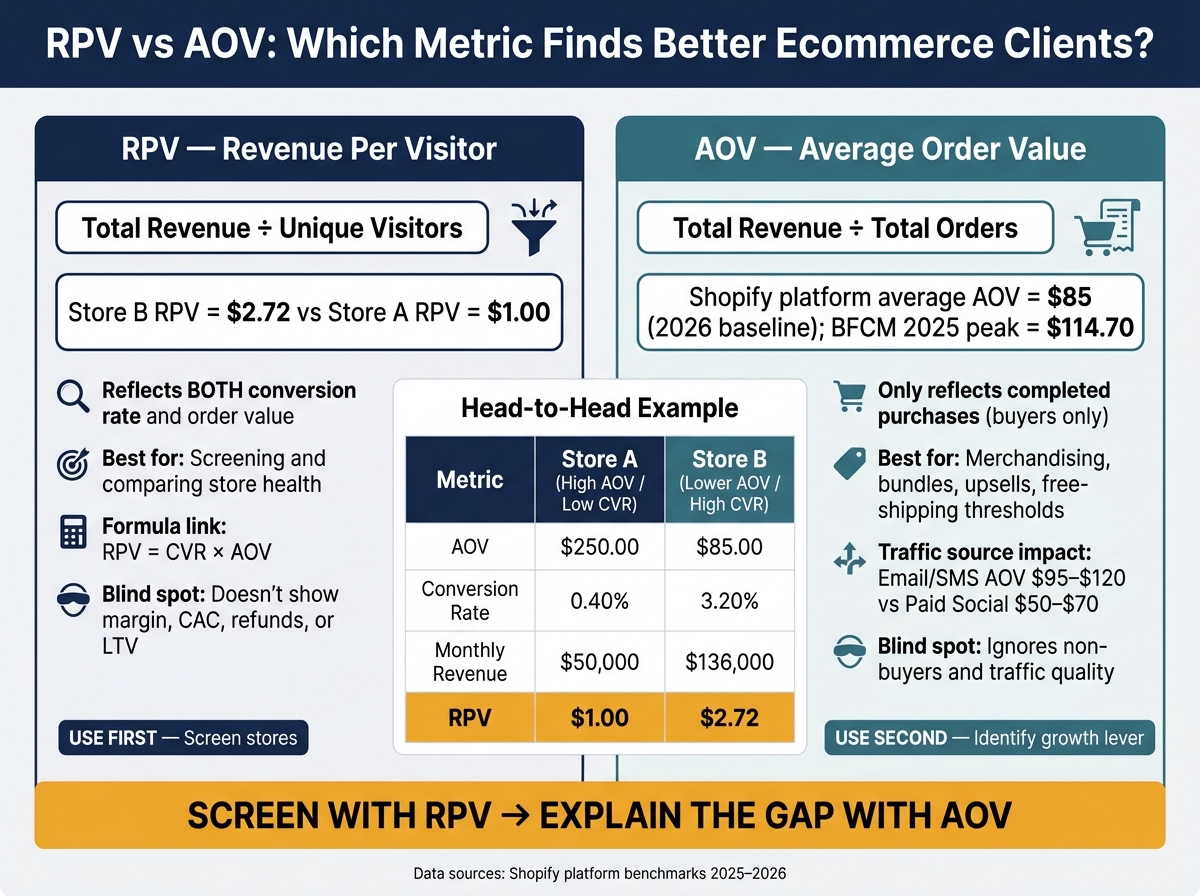
RPV vs AOV: Which Ecommerce Metric Matters More?
Quick Comparison
| Metric | Formula | Best Use | Main Blind Spot |
|---|---|---|---|
| RPV | Revenue ÷ Unique Visitors | Screen stores and compare monetization | Does not show margin, CAC, refunds, or LTV |
| AOV | Revenue ÷ Orders | Study order size and merchandising | Does not show traffic quality or non-buyers |
If I’m qualifying ecommerce leads, my rule is simple: screen with RPV, then use AOV to explain the gap.
sbb-itb-61169e3
RPV vs AOV: definitions, formulas, and what each metric misses
Revenue per visitor (RPV)
RPV = Total Revenue ÷ Total Unique Visitors for the same reporting period. Since it includes all visitors, RPV shows how much revenue each visitor generates on average. That makes it a handy screening metric for stores because it reflects the combined effect of conversion rate and order value.
Average order value (AOV)
AOV = Total Revenue ÷ Total Orders. This metric looks only at completed purchases, so it tells you how much buyers spend per order. That makes it useful for merchandising analysis, especially when you want to see whether bundles, cross-sells, and upsells are doing their job.
The platform-wide average AOV for Shopify stores in 2026 is $85 [1]. On paper, that can look solid. But there’s a catch: AOV can stay high even when conversion is weak. So while AOV helps you study buyer behavior, it’s not a strong standalone filter for prospecting.
Here’s the side-by-side view:
| Metric | Formula | Denominator | What It Reveals | What It Misses |
|---|---|---|---|---|
| RPV | Total Revenue / Total Unique Visitors | Unique Visitors | Blended store efficiency; combines CVR and AOV. | Profit margins and long-term customer value (LTV). |
| AOV | Total Revenue / Total Orders | Completed Orders | Merchandising and upsell effectiveness. | Traffic quality and the behavior of non-purchasing visitors. |
Visitor, session, and attribution consistency
This is where store comparisons often go sideways. Visitor and session do not mean the same thing. One visitor can create multiple sessions, so RPV based on sessions will not match RPV based on unique visitors.
There’s another wrinkle: Shopify’s native dashboard and Google Analytics may show different visitor counts for the same store because they use different attribution models. That can throw off comparisons fast.
Before you compare stores or time periods, spell out the denominator: unique visitors or sessions. Then stick with the same data source, reporting period, and attribution model [1]. Once that piece is locked in, your comparisons are much cleaner.
Why AOV can hide weak conversion and mislead agency prospecting
A high AOV does not mean a healthy store
AOV only tells you what buyers spend. It says nothing about the much bigger group of people who visit and leave without buying. That gap is where agencies can get fooled.
Say two stores each get 50,000 monthly visitors. One posts a $250.00 AOV but converts just 0.40% of traffic. The other has an $85.00 AOV and a 3.20% conversion rate. Once you factor in conversion, the picture changes fast:
| Metric | Store A (High AOV / Low CVR) | Store B (Lower AOV / High CVR) |
|---|---|---|
| AOV | $250.00 | $85.00 |
| Conversion Rate (CVR) | 0.40% | 3.20% |
| Total Monthly Revenue | $50,000 | $136,000 |
| Revenue Per Visitor (RPV) | $1.00 | $2.72 |
This is the problem with judging a store by AOV alone. Store A looks strong at first glance, but its 0.40% CVR sits well below the platform-wide Shopify median of 1.4% [1]. That points to a weak funnel, not a healthy one. Store B converts at 8× the rate and brings in $2.72 per visitor versus $1.00 for Store A. Once you look at RPV, the difference is hard to miss.
Common reasons AOV gets inflated
AOV can look better than the business behind it for a few pretty common reasons.
Mixed wholesale and DTC orders are one of the biggest ones. A few large wholesale purchases can push the average up, even if the normal shopper spends much less. Seasonality can do the same thing. During Black Friday/Cyber Monday 2025, the average Shopify cart hit $114.70, compared with the $85 yearly baseline [1].
Traffic source matters too. Email and SMS traffic tends to drive AOVs in the $95 to $120 range, while paid social usually lands around $50 to $70 [1]. That sounds great until you realize the lift may vanish once the brand starts going after colder traffic at scale. On top of that, a handful of unusually large orders can skew the average in ways you won't catch unless you look at order-level data.
What to check before trusting AOV
Before you treat a prospect's AOV like proof of store quality, sanity-check the context.
Start with the split between new and returning customers. Repeat buyers drive 41% of total revenue in established Shopify stores [1]. So if AOV is high mostly because returning customers spend more, that may say more about retention than about the store's ability to convert new visitors.
Then look at device mix and traffic mix together. Mobile makes up 79% of Shopify visits, yet it converts 37% lower than desktop [1]. A blended AOV can hide a rough mobile experience that quietly leaks sales, especially when the higher order values are coming from warm email traffic or one product line that may not hold up as reach expands.
That context is why RPV is the next number to check.
When RPV gives a cleaner read on store health
RPV is a cleaner way to read store health because it rolls traffic quality and basket size into one number. That matters. A store can’t look strong just because the people who do buy happen to spend a lot.
What strong or weak RPV usually signals
For prospecting, RPV helps show whether a store is doing well on traffic, conversion, or both. When you compare RPV with AOV, you can usually spot where the issue sits [1].
| RPV + AOV Combination | Suggests | Where to Focus |
|---|---|---|
| High RPV / High AOV | Premium positioning, higher-ticket orders, lower conversion volume | CVR optimization: trust signals, scarcity, white-glove CX |
| High RPV / Low AOV | Efficient conversion, repeat demand or fast purchase intent | AOV expansion: subscriptions, bundles, loyalty perks |
| Low RPV / High AOV | Conversion friction, long research, or weak traffic fit | UX and trust: social proof, expert reviews, checkout simplification |
| Low RPV / Low AOV | Weak offer, poor merchandising, or cold traffic | Foundational fixes: site speed, mobile UX, basic email automation |
The key is context. Compare RPV against the store’s own category, not some platform-wide benchmark. The same number can tell very different stories in Beauty versus Gifts [1].
What RPV still cannot tell you
RPV shows how well a store turns visits into revenue. But it doesn’t tell you everything. It leaves out margin, CAC, refunds, and LTV, so it works best as an early screen before you dig deeper [1].
Blended RPV can also blur what’s happening across channels. Email and SMS often beat paid social, which means the traffic mix can make the average look better than it is [1].
Use RPV first to screen the store. Then check AOV to figure out whether the fix is conversion, merchandising, or a mix of both.
How to use RPV and AOV together in lead qualification
Once you know what each metric means, the next step is figuring out which one to use first in prospecting. The order matters.
Start with RPV. It tells you whether a store turns traffic into revenue before you look at basket size.
Start with RPV to screen stores faster
Use RPV first to filter out stores that look busy but don’t make much from that traffic by analyzing their tech stacks. A high-traffic store with below-benchmark RPV is often a better prospect than a smaller store that’s already doing well. That gap is where the sales angle lives.
Use the same niche benchmark set across every prospect. A 1.8% CVR can look strong in Electronics but be a red flag in Beauty [1]. Compare each store against similar business models in similar categories.
Once RPV narrows the list, AOV helps you spot which growth lever is most likely to move revenue.
Use AOV to identify the likely service lever
After a store clears the RPV screen, AOV tells you what to pitch. If a store’s AOV sits below its niche benchmark, that usually points to offers like:
- Bundles
- Upsells
- Free-shipping thresholds
- Subscriptions
If CVR looks healthy but RPV is still low, AOV is likely the constraint. That’s a very different story from a store with a weak checkout flow, and it points to a different service offer.
Here’s a simple way to qualify a store in minutes:
| Metric | What to Inspect | What It Means |
|---|---|---|
| RPV | Compare vs. niche benchmark (e.g., $2.91 for Beauty, $1.45 for Pet) [1] | Low RPV + high traffic = strong optimization opportunity |
| CVR | Check niche-specific floor/ceiling; mobile vs. desktop CVR gap [1] | Low CVR = UX/trust issue; high CVR = AOV is the bottleneck |
| AOV | Check vs. niche benchmark [1] | Below benchmark = pitch bundles, upsells, or free-shipping thresholds |
| Traffic Volume | Monthly visitors: Micro <10k, Small 10k–50k, Mid 50k–250k, Large 250k+ [1] | Mid-tier stores are often the best place to look for monetization gaps |
| Customer Mix | New vs. repeat ratio; repeat customers drive 41% of revenue in established stores [1] | Low repeat share = retention and email opportunity |
StoreCensus lets you run this scorecard across 6M+ Shopify and WooCommerce stores.
Conclusion: the better metric for better clients
Neither RPV nor AOV works well on its own. AOV shows how much buyers spend per order. RPV shows how well a store turns each visit into revenue. Put them together, and you get a much clearer view of the account.
RPV screens the store. AOV tells you what to sell.
FAQs
When should I use RPV instead of AOV?
Use Revenue Per Visitor (RPV) when you need one metric to compare store performance across niches.
Why? Because RPV blends conversion rate and average order value into a single number. That gives you a clearer view of overall store health than AOV alone. A high AOV can look good on paper while weak conversion drags down revenue.
RPV also helps you pinpoint the main problem faster: low conversion or low order value.
Can RPV be misleading on its own?
Yes. Revenue per visitor (RPV) can be misleading on its own because it rolls conversion rate (CVR) and average order value (AOV) into a single metric.
That sounds neat, but it can blur what's actually happening. A high or low RPV doesn't tell you which part is driving the result. And that's the problem.
If RPV drops, is the issue that fewer people are buying? Or that shoppers are buying, but spending less per order? Those are two very different problems. One points to CVR. The other points to AOV.
When you look at RPV by itself, that distinction can get lost. And once that happens, it's easy to chase the wrong fix.
How do I calculate RPV correctly?
Use RPV = Total Revenue ÷ Total Sessions. If you want a cleaner audit, calculate it with data from the last 30 days.
You can also work out RPV as CVR × AOV. That’s because it blends conversion rate with average order value into one number. When you compare your RPV against niche-specific benchmarks, you can get a clearer sense of where the bigger issue sits: conversion optimization or order value tactics.