
Magento vs Salesforce Commerce Cloud: Store Benchmarks
Compare Magento and Salesforce Commerce Cloud store benchmarks to target accounts by revenue, geography, stack depth, and recent change.


If I were building an agency target list today, I’d treat Magento and Salesforce Commerce Cloud very differently. Magento usually points to stores with heavier build work, back-end connections, and multi-store needs. SFCC more often points to larger brand groups, more country rollouts, and deeper Salesforce ties.
Here’s the short version:
- Magento tends to show up across a broader revenue range, from smaller stores to large merchants
- SFCC leans more toward upper mid-market and enterprise accounts
- Magento often shows more visible front-end stack layers like analytics, payments, hosting, and custom add-ons
- SFCC often signals business-system depth, especially when I see Salesforce tools around it
- Country mix, category, stack depth, and recent changes are better filters than platform name alone
- Recent movement matters most: new ERP work, new regional stores, added personalization tools, or new domains usually mean active spend
A few numbers make the split clear:
- Magento detection data cited here shows about 42,965 U.S. sites
- SFCC estimates cited here show about 5,267 live stores in Q2 2026, plus about 17,900 domain-level websites
- Magento category share in one dataset is led by shopping (49%), then fashion and beauty (14%)
- Magento stack signals include Google Analytics on 67.1% of detected stores and Cloudflare on 56.1%
- SFCC often clusters in the U.S., France, the U.K., Italy, and Germany
If you only remember one thing, make it this: don’t sort accounts by platform alone. I’d rank them by revenue band, geography, category, stack depth, and 90-day change signals. That gives me a better shot at finding stores that are in-market now, not six months from now.
Magento vs Salesforce Commerce Cloud: Choosing a Platform for Big eCommerce Players
sbb-itb-61169e3
Quick Comparison
| Criteria | Magento / Adobe Commerce | Salesforce Commerce Cloud |
|---|---|---|
| Revenue profile | Broader spread from mid-market to enterprise | More concentrated in larger accounts |
| Country pattern | Strong in the U.S., U.K., Germany, Australia, Canada | Strong in the U.S., France, the U.K., Italy, Germany |
| Category pattern | Apparel, B2B distribution, manufacturing, automotive, home, beauty | Fashion, beauty, consumer goods, branded retail, sporting goods |
| Stack pattern | More visible site-layer tools and custom build signals | More business-system and Salesforce ecosystem signals |
| Common account shape | Multi-store, ERP/PIM-heavy, custom workflows | Multi-brand, multi-country, Salesforce-connected journeys |
| Best outreach angle | Upgrades, integrations, performance, platform risk | Rollouts, personalization, Salesforce expansion, market launch |
| Best near-term trigger | ERP/PIM changes, added storefronts, infra strain | Added Salesforce products, localization, country expansion |
So this piece is best read as a targeting guide, not a feature comparison. I’d use it to sort lists, spot better-fit accounts, and write outreach around the changes I can already see.
Benchmark methodology and comparison rules
Data was collected on September 29, 2026 and refreshed weekly.
The dataset covers active, publicly discoverable Magento/Adobe Commerce and Salesforce Commerce Cloud storefronts. It leaves out parked domains, marketplaces, development sites, duplicate URLs, and unverified platform signals. Technology trackers detect far more live Magento sites than Salesforce Commerce Cloud sites, and that gap is reported as-is. That's why this article separates store-level counts from company-level counts.
One brand can run several storefronts on a single installation. So the results are split into storefronts, companies, and raw records to avoid double counting.
The 5 benchmark dimensions used in this article
This comparison uses five fixed dimensions.
| Dimension | Definition |
|---|---|
| Estimated revenue bands | Modeled ranges such as under $1 million, $1 million–$10 million, $10 million–$50 million, and $50 million+ in annual revenue or GMV [1][3] |
| Country mix | Primary country is assigned from domain, currency, locale, fulfillment, headquarters, and registration signals; storefront market and company headquarters are reported separately when data allows |
| Category spread | One primary category from a 36-vertical taxonomy (for example, Fashion & Apparel, Health & Wellness, or B2B/Wholesale); mixed-category retailers are assigned to their dominant vertical [3][2] |
| Stack depth | Count of detected technology layers - payments, analytics, search, personalization, reviews, CRM, ERP, CDN, and related layers - detected via JavaScript signatures, API patterns, and HTML markers [1] |
| Growth signals | Observable changes over a fixed 90-day lookback, including technology additions or removals, revenue tier shifts, domain changes, and storefront launches [3] |
Keeping these definitions fixed helps separate platform capability from observed merchant behavior. Put simply, it keeps the article from mixing up what a platform can do with what merchants are actually doing.
How to read confidence levels in observed commerce data
Every main finding in this article has an implied confidence level based on signal quality.
- High confidence means the platform was detected through multiple independent signals and validated across repeated scans [1].
- Medium confidence means there is a strong but limited fingerprint, with revenue, category, or country inferred from supporting signals.
- Low confidence means the result relies on a single weak signal, limited observations, incomplete company matching, or a revenue estimate near a band boundary.
Treat revenue bands as directional estimates, not audited financial data. They point you in the right direction, but they aren't the same as a filed earnings report.
Confidence levels are also useful for ranking outreach priorities. And when a technology isn't detected, that should be read as not observed - not proof that the merchant doesn't use it [1]. That's a small detail, but it matters a lot when stack depth is compared across two platforms with different detection footprints.
The next sections apply these rules to Magento and Salesforce Commerce Cloud separately.
Magento store benchmarks
When you apply those benchmark rules, Magento tends to lean toward merchants with more moving parts. It often attracts businesses running multi-store catalogs, B2B pricing setups, and deep back-office connections. For agencies, that usually means bigger project scopes and longer retainer work.
Revenue bands, countries, and categories
Magento’s store base leans mid-market and enterprise. The most useful way to break it down is by estimated annual revenue band: under $1 million, $1 million–$10 million, $10 million–$50 million, and $50 million+.
These bands work best as directional groups, not hard lines. In practice:
- Stores under $1 million often need performance, hosting, and security help.
- Stores in the $1 million–$10 million range usually need integrations and optimization.
- Stores above $10 million are more likely to need multi-store architecture, ERP/PIM connections, and steady technical support.
One technology-detection dataset estimates about 42,965 Magento-powered sites in the United States, more than 10,300 in the United Kingdom, roughly 8,990 in the Netherlands, about 8,160 in Germany, and approximately 4,390 in Italy.[7][6] Germany leans B2B and ERP-heavy, while Italy leans fashion and premium retail.[6]
The category mix backs that up. Shopping accounts for about 49% of detected Magento sites, followed by fashion and beauty at 14%, technology and computing at 12%, wholesale and distribution at 12%, food and drink at 6.5%, and construction at 6.2%.[10]
For agencies, wholesale and distribution stands out most. That’s where pricing rules, quoting flows, and ERP sync often show up fast.
Stack depth and visible growth signals
The stack data tells the same story: Magento stores often run with a deeper setup. Google Tag Manager appears on about 53.0% of detected Magento stores, and Google Ads Pixel on 47.4%.[5] Google Analytics shows up on roughly 67.1%, while Cloudflare appears on 56.1% of detected Magento domains.[8]
Those numbers can shift by dataset and detection method, so treat them as directional.
What should you watch for? New integrations, new regional or language storefronts, platform or frontend changes, and ecommerce hiring. When you see two or three of those at the same time, the picture gets a lot clearer. A new ERP integration, a new regional storefront, and active hiring usually point to a merchant that’s putting money into scale.
What Magento benchmarks mean for agency positioning
The benchmark data points to a pretty clear service map. Stores running older or overloaded implementations are good fits for migration, upgrade, performance engineering, hosting, and security work. Stores dealing with disconnected systems across payments, logistics, and marketing are good fits for ERP, PIM, CRM, payment, logistics, and analytics integration.
Regional expansion changes the pitch too. Those merchants often need multi-store architecture, localization, tax and payment setup, and international fulfillment support. And when a store shows recurring technical changes or active ecommerce hiring, it’s usually a better match for an ongoing technical retainer than a one-off project.
One migration-value study found that merchants moving to Magento Commerce 2 achieved a 165.3% three-year ROI and an average 8.1-month payback period, with respondents attributing a 2.1% first-year GMV increase and a 4.8% first-year increase in average order value to the platform.[9] Those numbers reflect survey respondents under specific conditions, but they still give you a business case you can use in migration and modernization talks.
Lead with the operational problem you can see, not a platform pitch. For example: your multi-region Magento stack may be duplicating catalog and tax work. These patterns form the Magento baseline for the Salesforce Commerce Cloud comparison that follows.
Salesforce Commerce Cloud store benchmarks
SFCC tends to lean enterprise. Brands on the platform often want managed infrastructure and closer alignment with Salesforce than Magento usually offers.
One 2026 estimate put the market at about 5,267 live SFCC stores in Q2 2026 and about 17,900 domain-level websites.[19] That gap matters. Domain counts can inflate the picture when one parent company runs many sites, so it’s smart to deduplicate before treating either number as your working total.[19] After that, the real question becomes simple: which accounts should you go after first?
Revenue bands, countries, and categories
SFCC’s public customer records cover a wide revenue range. On the mid-market side, there are brands like alice + olivia, with about $50 million in reported revenue.[11][13] But much of the base skews larger, often with multiple regions, brands, or business units in play.[11][13]
Geographically, the footprint clusters in the U.S., France, the U.K., Italy, and Germany.[12][13][17] One domain-level estimate put U.S.-associated websites at about 9,739.[19] That kind of spread often comes with a catch: more regions usually mean more systems, more handoffs, and more complexity.
Category mix stands out too. Retail is the biggest group, followed by Retail Apparel and Fashion. You also see stores across manufacturing, consumer packaged goods, distribution, sporting goods, luxury, beauty, and transportation.[11][12][14] Fashion, apparel, and luxury form a dense pocket of the market. For agencies, that’s a strong case for vertical proof points tied to catalog management, personalization, and international checkout.
Stack depth and Salesforce ecosystem signals
SFCC stacks are often broad, not shallow. Capterra lists more than 90 integrations for the platform, including Adyen, Avalara, Akeneo Product Cloud, Bazaarvoice, Celigo Integrator.io, and Bolt.[18] In practice, you’ll often find layers for CRM, marketing, service, analytics, personalization, search, payments, tax, ERP, OMS, and CDP.
But stack size alone doesn’t tell the full story. The stronger signal is Salesforce ecosystem fit. A storefront using SFCC alongside Sales Cloud, Service Cloud, Marketing Cloud, Data Cloud, or MuleSoft is a very different kind of account from one using SFCC on its own.[4][15][16] That usually points to more cross-team coordination, more systems work, and more room for agency support.
There’s also a technical wrinkle here. Missing client-side scripts don’t prove an integration isn’t there. A lot of server-side connections leave no visible tag at all.
What Salesforce Commerce Cloud benchmarks mean for agency positioning
For agencies, these patterns matter when they turn into actual delivery work: rollout, integration, governance, and market-by-market execution.
The best prospects often show signs like:
- Multiple country domains
- Localized experiences
- Regional checkout flows
Those are strong clues that the account is dealing with international rollout, catalog governance, tax and payment complexity, and performance work across markets.
It also helps to focus on prospects that already have several layers in place, such as CRM, marketing, service, analytics, search, PIM, ERP, OMS, payments, and shipping. That’s the core SFCC profile in many cases: enterprise-heavy, multi-country, and integration-rich. Outreach should reflect that reality and lean into international rollout and systems work.
Magento vs Salesforce Commerce Cloud: what the numbers mean for targeting
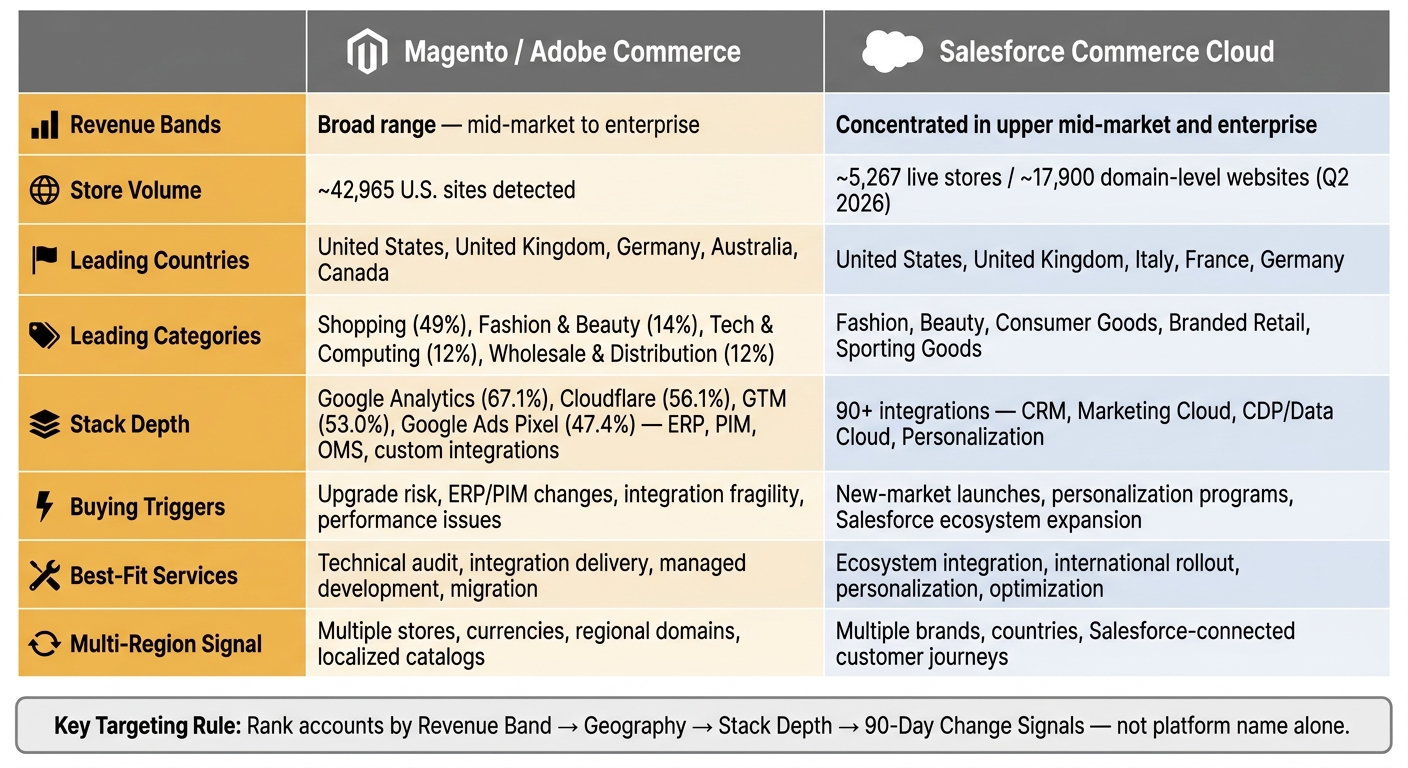
Magento vs Salesforce Commerce Cloud: Platform Targeting Benchmarks
Side-by-side benchmark comparison
These benchmarks help you rank accounts and shape outreach with more precision. Instead of treating Magento / Adobe Commerce and Salesforce Commerce Cloud stores the same way, use the patterns below as clear targeting signals.
| Dimension | Magento / Adobe Commerce | Salesforce Commerce Cloud |
|---|---|---|
| Revenue bands | Broad range, from mid-market to enterprise | More concentrated in upper mid-market and enterprise |
| Stack depth | Deep and visible: ERP, PIM, OMS, payments, search, hosting, and custom integrations | Deep in business systems: CRM, Marketing Cloud, CDP/Data Cloud, and personalization |
| Leading countries | United States, United Kingdom, Germany, Australia, Canada | United States, United Kingdom, Italy, France, Germany |
| Leading categories | Apparel, B2B distribution, manufacturing, automotive, home and garden, health and beauty | Fashion, beauty, consumer goods, branded retail, sporting goods |
| Multi-region signal | Multiple stores, currencies, regional domains, or localized catalogs | Multiple brands, countries, or Salesforce-connected customer journeys |
| Technical complexity | High customization and infrastructure ownership | Enterprise orchestration in a managed SaaS model with Salesforce alignment |
| Buying triggers | Upgrade risk, integration fragility, performance, ERP or PIM changes | Personalization programs, new-market launches, Salesforce expansion |
| Best-fit service motion | Technical audit, integration delivery, managed development | Ecosystem integration, international rollout, personalization, optimization |
Magento tends to point to customization and infrastructure ownership. Salesforce Commerce Cloud points more often to enterprise orchestration and close Salesforce alignment.
If you need a simple way to sort targets, start with the strongest signals:
- Revenue band
- Geography
- Stack depth
- Recent change
How agencies should segment lists and tailor outreach
Revenue band usually tells you a lot about service fit. Mid-market Magento accounts often respond to modernization, performance, and integration offers. Larger Magento accounts are more likely to need architecture governance, ERP/OMS work, and help reducing upgrade risk.
SFCC accounts work a bit differently. When you see multiple regional storefronts or deep Salesforce ecosystem involvement, the better angle is often personalization, international rollout, and enterprise optimization. That’s where the pitch tends to land.
Recent change matters even more than platform identity. That’s the part many teams miss.
A Magento merchant with a brittle mix of custom extensions, a recent ERP change, and a second country-specific domain is a much better target than a similar-size store with no visible movement. The same idea applies on the SFCC side. If an account is adding personalization tools or bringing in a new Salesforce product, that usually signals active investment and near-term demand.
So when you build lists, filter by revenue, stack depth, country cluster, category, and recent change. Then connect outreach to the exact business problem in front of that account. No fluff. No vague “we help ecommerce brands grow” messaging. Show that you already see what’s changing.
Conclusion: from benchmark data to better targeting
The agencies that win new business on a steady basis build ICP rules around revenue, geography, category, and observable change. Then they write outreach that proves they already understand the merchant’s situation before the first call.
FAQs
How should I prioritize Magento vs. SFCC accounts?
Start with the merchant’s needs. Magento makes sense for businesses with complex workflows, open-source flexibility, and in-house or agency development support. SFCC is often the better choice for large global brands that need a scalable, all-in-one enterprise platform.
With StoreCensus, you can filter by platform first. Then narrow the list by estimated monthly revenue ranges and employee counts to spot higher-value prospects that are more likely to have the budget for enterprise-level services.
Which buying signals matter most for agency outreach?
The most important buying signals are real-time growth and intent indicators, including:
- Recent app installs or removals
- Pixel adoption changes, such as Meta or TikTok
- Theme or storefront upgrades
- Revenue or traffic shifts, including new revenue milestones
When you pair those with fit signals like revenue tier, category, and country mix, you can reach merchants at the exact moment their tech stack and marketing spend are changing.
How reliable are revenue and stack benchmarks?
They work well as directional guidance for market sizing and competitive analysis, but not as audited financial figures.
Revenue estimates come from proprietary models that use traffic, catalog size, pricing, and industry benchmarks. They’re usually accurate within 30% to 50%. Stack data relies on detection, so it can miss some non-standard setups.