
Social Signals and App Stack: Lead Score Guide
Score social intent and app-stack fit separately, weight fit 60%/intent 40%, and prioritize outreach with clear score bands.

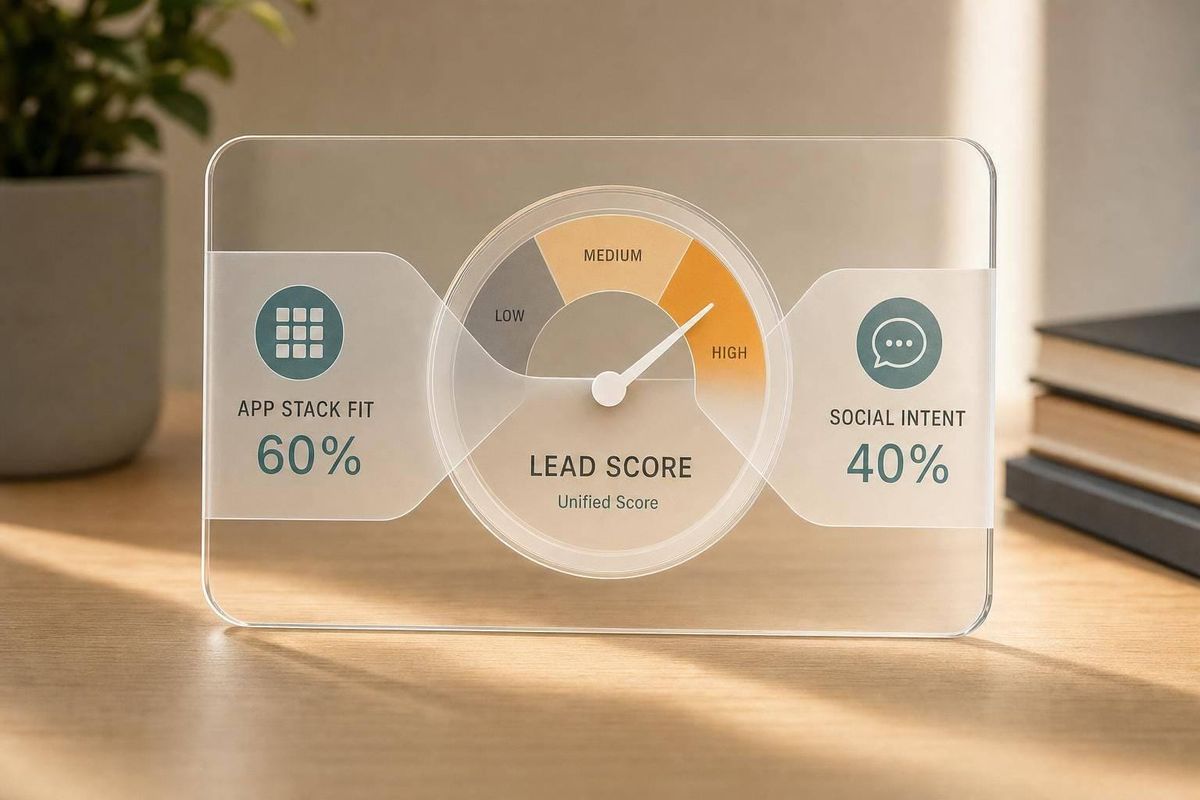
Most lead scores miss the point: they track activity or fit, but not both. I’d use social signals to spot near-term buying intent and app stack data to check whether a store has a gap I can sell into. Then I’d score each on a 0–100 scale, weight fit at 60% and intent at 40%, and sort leads into clear action tiers.
If I wanted the short version, it would be this:
-
Social signals = timing
- Posting pace
- Comments and shares
- Product mentions
- Meta or TikTok ad activity
-
App stack signals = fit
- Missing tools
- Theme age
- Tracking depth
- New installs or removals
-
Best lead setup = demand + gap
- Heavy content output + weak email setup
- High engagement + slow or old theme
- Strong product buzz + no review tool
-
Use score bands to act fast
- 80–100: direct outreach within 24 hours
- 50–79: light nurture
- Below 50: wait and re-check later
A few numbers make the case. Stores with 50,000+ monthly visits average a lead fit score of 96.9, versus 60.2 for lower-traffic stores. Cart abandonment emails see a 50.5% open rate and 3.33% conversion rate. A 1-second load delay can cut conversions by 7%. And products with 1–10 reviews are 52.2% more likely to convert than products with none.
Here’s the core idea in one view:
| Part | What I’d check | What it tells me |
|---|---|---|
| Social intent | Posting pace, engagement, mentions, ads | Whether the merchant is in growth mode now |
| App stack fit | Tools, missing categories, theme, pixels, stack changes | Whether there is a service gap worth pitching |
| Combined score | 60% fit + 40% intent | Who gets outreach first |
The main takeaway: I’d keep fit and timing separate, score them on their own, and only then combine them. That gives me a lead list I can use, not just a big spreadsheet.
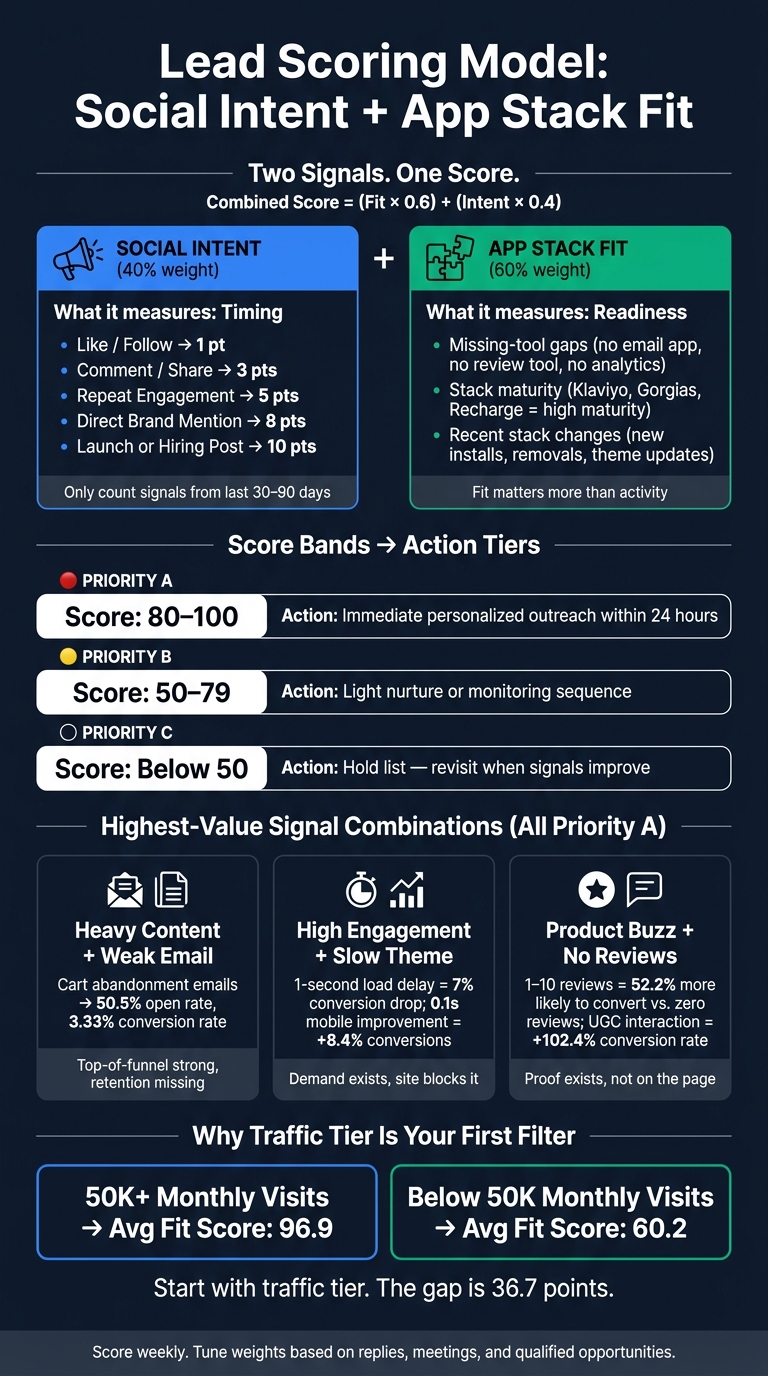
Lead Scoring Model: Social Intent vs App Stack Fit
Mastering Lead Scoring: Simple Steps to Boost Conversions
sbb-itb-61169e3
Step 1: Define the Scoring Model
Separate scoring helps you see two different things at once: whether a lead is active and whether it's ready. Those aren't always the same.
A merchant can look busy on social and still be a poor fit. On the flip side, a merchant can have a clear stack gap and show only modest engagement. That's why it makes sense to score both sides on their own first.
Use a 0–100 scale for each score, then combine them into a weighted total for routing. You can set this up in a spreadsheet, CRM, or outbound tool. No custom code required.
The next move is simple: find and target Shopify stores by assigning points based on how much each signal should matter.
Score Social Intent by How Strong and Recent the Signal Is
Use a simple ladder:
- like/follow = 1
- comment/share = 3
- repeat engagement = 5
- direct brand mention = 8
- launch or hiring post = 10
A link click from a social post should score high because it shows stronger intent. Repeated and intentional actions should always outrank shallow engagement.
Only count signals from the last 30 to 90 days.
Score App Stack Fit by Gaps, Maturity, and Change
Score three dimensions on their own: missing-tool gaps, stack maturity, and recent change.
Missing-tool gaps are the clearest fit signal. No review app, no dedicated email platform, or no analytics beyond the default Shopify dashboard usually points to a clear service opportunity.
Stack maturity looks at how far along the store is. A store running tools like Klaviyo, Gorgias, and Recharge with a well-maintained theme signals a merchant that already invests in infrastructure. That tells you whether the merchant can buy, not just whether they're active.
Recent stack changes tend to be the most time-sensitive signal. A new app, theme update, or removed app can point to budget, active troubleshooting, or a vendor switch.
Once fit is scored, weight it against intent and route the lead by tier.
Set Weights and Score Bands
Weight app stack fit at 60% and social intent at 40%. High activity doesn't matter much if the stack already fits. In many cases, a merchant with a clear stack gap and moderate social activity is the better target.
Once you have a combined score, route leads into three tiers:
| Tier | Score Range | Action |
|---|---|---|
| Priority A | 80–100 | Immediate, personalized outreach within 24 hours |
| Priority B | 50–79 | Lighter nurture or monitoring sequence |
| Priority C | Below 50 | Hold list - revisit when signals improve |
Calibrate the bands to match your capacity, then use the top tier in Step 2.
Step 2: Build Rules for the Highest-Value Signal Combinations
Paired signals tend to point to the best leads. When you use both scores together, you can rank the combinations with the most upside. These deserve the most weight because they show intent and fit at the same time.
The fastest wins usually come from combinations that show urgency plus an obvious service gap.
Signal Combinations Worth Prioritizing:
- Heavy content output + weak email setup - Top-of-funnel activity is strong, but email retention is missing
- High engagement + slow or aging site theme - Demand exists, but the store may be blocking conversion
- Strong product buzz + missing review tools - Social proof is absent at the point of purchase
Heavy Content Output Plus Weak Email Setup
Here’s what that looks like in practice. A brand posting four or more times per week across Instagram Reels, TikTok, and long-form content is driving real top-of-funnel activity. But if the store has weak email capture and no automation, it’s building attention without holding onto it.
That gap can be expensive. Cart abandonment flows average a 50.5% open rate and 3.33% conversion rate, with average revenue per recipient reaching $3.65 and $28.89 for the top 10%[5][9]. So if traffic and content activity are already there, but retention systems are weak, the fit score should go up fast. Mark this as Priority A.
Pitch email capture and automation as the way to monetize demand that already exists.
The same pattern shows up when engagement is high but the site slows buyers down.
High Engagement Plus a Slow or Aging Site Theme
Strong comments, shares, saves, and user-generated mentions are clear signs that people care. But if the site runs on a slow, dated theme with no performance tools, that interest can stall before it turns into revenue.
And this isn’t just a design debate. A 1-second delay in page load reduces conversions by 7%[8][10], while a 0.1-second improvement in mobile speed can lift retail conversions by 8.4%[3][4]. That’s a measurable gap. Not a matter of taste. Mark this as Priority A.
Tie site speed straight to lost conversions and mobile revenue.
Once demand is visible, the next weak spot is often social proof.
Strong Product Buzz Plus Missing Review Tools
Rising mentions, hashtag use, customer tags, creator shoutouts, and active comments all point to real demand. But if the product page has no review feature or UGC module, that proof disappears right before the buying decision.
That’s a missed chance. Products with 1 to 10 reviews are 52.2% more likely to convert than products with none, and visitors who interact with UGC convert at a 102.4% higher rate[6][7]. Picture a supplements brand getting praise in Reddit threads and TikTok comments, while the product page shows zero on-site reviews. That’s the gap in plain sight. Mark this as Priority A.
This belongs in the top tier because the proof exists, but it isn’t showing up where buyers need it most. Put that proof on the product page.
Step 3: Turn the Score into a Working Prospecting System
A score only matters if it changes what your team does every day. Start with fit. Then check timing.
Find and Segment Merchants by Stack and Growth Signals
Filter first, research second.
Build your first list using Shopify store guides for revenue tier, platform, theme type, country, and missing-tool patterns. Then add social research to check timing. StoreCensus lets you filter 6M+ Shopify and WooCommerce stores by revenue, tech stack, theme, country, and growth signals. It also surfaces decision-maker contacts.
Traffic tier should be your first filter. Stores with 50K+ monthly traffic average a lead fit score of 96.9, compared to 60.2 for stores below that mark [2]. That’s a huge gap, and it gives you a simple place to start.
Use the same gap types from Step 2, but do it at scale. After traffic, keep only accounts with a verified contact and one clear gap. Once the list is trimmed down, score each account and send it to the right tier.
Route Leads into Outreach Sequences by Score Tier
Match the level of outreach to the score band.
| Score Band | Outreach Effort | Pitch Angle |
|---|---|---|
| 95–100 | Manual research, custom first line, specific offer | Name the exact gap you found |
| 85–94 | Personalized template + one store-specific observation | Tie the gap to a revenue outcome |
| 70–84 | Light automated campaign, only if a gap is present | Simple value angle, minimal customization |
| Under 70 | Move to long-term nurture or remove | No active outreach |
The message should match the gap you found.
An email agency pitching a store with 50K+ traffic, an active Meta Pixel, and no visible email app should lead with: "Paid traffic is leaking." A design agency pitching a Shopify Plus store on a free theme should lead with: "Your storefront no longer matches your platform investment."
That’s the core idea: the gap is the pitch, and the score sets priority. Use that same approach when signals shift and an account needs another look.
Refresh Scores When Signals Change
Scores get old fast.
Ecommerce tech stacks change all the time. Apps get installed and removed. New Facebook or Instagram ads go live. Stores start posting more often. New products launch. Marketing job openings pop up [1]. Because of that, refresh scores every week. For high-priority merchants, set near-real-time alerts for app installs, app removals, or social spikes [1][2].
An app removal can mean a gap just opened. A social spike can mean the window is starting to close. Treat your prospect list like a live system, not a static export. Add new stores that now qualify, and re-score current accounts each week to keep the pipeline current [1].
Conclusion: Score fit and timing separately, then combine them
With the scoring rules set, the last part is straightforward: score fit first, then add timing and pain.
Traffic tier and category help you screen for ICP fit. App stack depth and active ad markers show whether now is the right time to reach out. A lead score only works when it includes fit, pain, reachability, and timing - and the paired signal combinations from Step 2 are what separate a nice-looking account from a real sales target.
That still applies when the broader store data looks strong. Even strong stores often show stack gaps, and that's what gives you a clear reason to start the conversation.
Re-score weekly. Then adjust the weights based on replies, meetings, and qualified opportunities. In plain English: tune the model to match what actually books meetings.
The goal is a reliable prioritization layer.
FAQs
How do I score social intent and app stack fit together?
Use a composite 100-point model that blends firmographic fit with behavioral urgency.
Start with your ideal customer profile, then assign weights to signals like social engagement, pricing-page visits, app changes, tech stack maturity, and fit gaps.
Add points for high-intent behavior and strong app stack fit. Subtract points for poor-fit signals like low traffic or irrelevant categories.
The sweet spot is leads where engagement and operational changes show up at the same time. That’s often when a company is paying attention, making moves, and more open to a timely pitch.
Then use StoreCensus to trigger outreach when those signals line up, so your team reaches out when the timing makes sense - not days or weeks later.
Which signals should I track first?
Start with traffic volume. For ecommerce prospects, 50,000 monthly visitors is the first gate. It helps you spot stores that usually have enough scale, budget, and contact availability.
Then score each prospect in layers: fit, budget, pain, reachability, and timing. Check for a match in category and geography, signs of growth investment, clear gaps like missing email or review tools, decision-maker contact info, and live changes such as app installs, theme updates, or hiring.
How often should I refresh lead scores?
Refresh lead scores weekly so they stay aligned with current growth signals and merchant activity.
Run a monthly audit of your full database to remove stores that have pivoted or shut down. Then re-check scores after trigger events like app installs, theme migrations, or other store changes. Before each outreach batch, confirm the tech gap is still current and relevant.