Historical Revenue Trends in 1,000 Shopify Stores
Study of 1,000 Shopify stores shows app, theme, and platform changes that precede sustained revenue growth.

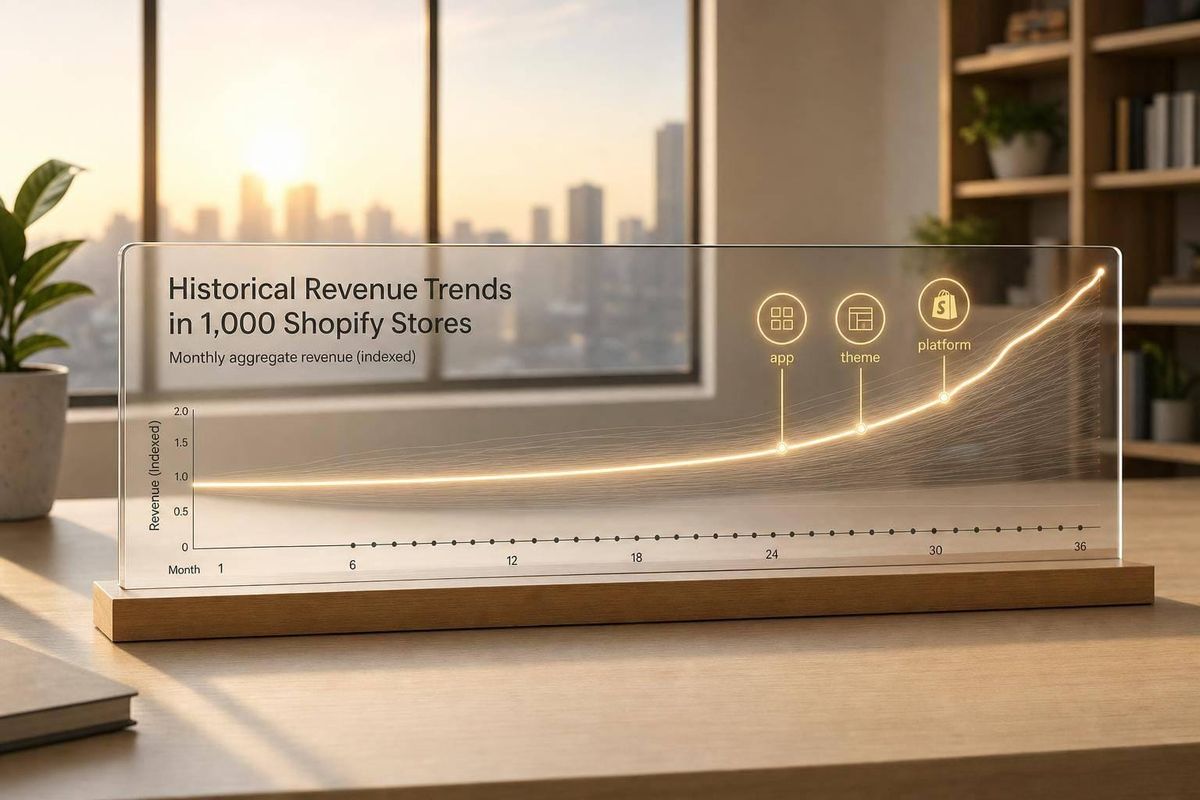
Most Shopify stores do not grow in a straight line - and the stores most likely to spend on help tend to show the same few signals first.
I’d sum up the study like this: revenue changes matter most when they line up with app stack changes, theme updates, and moves into higher revenue bands. Across 1,000 Shopify stores tracked from January 2024 to June 2026, the pattern is simple: stores that move up often add more apps, swap core tools, and make bigger site changes before outside spend shows up.
Here’s the short version:
- Revenue bands matter: stores were grouped from $1–$1,000 up to $100,000+ per month
- Category matters: Fashion & Apparel had the most stores, while Sports & Outdoors showed higher median traffic
- Country matters: high-revenue stores were concentrated in the U.S., U.K., Canada, Australia, and Germany
- App depth tends to grow with revenue: low-revenue stores often had thinner stacks, while higher-revenue stores used far more tools
- Certain app types often show up 3–6 months before growth turns up: CRO, retention, and merchandising tools were common
- Not every app spike leads to steady growth: heavy churn, overlap, and discount-heavy stacks often led to short lifts, then drop-offs
- Theme and platform changes can point to budget movement: custom theme moves and Shopify Plus migrations often came before agency work
- Clusters beat single signals: one app install means little on its own; several changes at once mean more
If you want the main takeaway in one line, it’s this: the best way to read Shopify revenue history is to pair revenue data with store-change signals, not look at sales in isolation.
Revenue patterns by category, country, and revenue tier
Revenue trend lines by category
Shopify categories don’t scale the same way. And that has a direct effect on revenue, traffic, and how many apps stores tend to use.
Fashion & Apparel is the biggest category, with 282,254 stores, 4.0 apps per store, and 1,000 median monthly visits [3].
Home & Garden keeps pace on traffic, also posting 1,000 median monthly visits, while averaging 3.7 apps per store [3]. It also shows up in the top revenue bands, with brands like Brooklinen and Arhaus estimated at more than $20M in annual revenue [4].
Beauty & Personal Care and Health & Wellness run deeper app stacks, averaging 4.8 and 4.5 apps per store [3].
Sports & Outdoors stands out on traffic. Its median is 2,000 monthly visits, about double the 1,000 median for Fashion & Apparel [3].
Those gaps help explain why some stores reach revenue turning points earlier than others.
Revenue concentration by country
The U.S., U.K., Canada, Australia, and Germany make up most high-revenue Shopify stores [5]. The U.K. and Canada also turn out standouts like Go Outdoors at $30.4M per year and Narwal Canada at $31.5M per year [4].
That concentration matters because moving into the next revenue band often comes down to how a store updates its stack.
How stores move between revenue tiers
Stores in this study fall into five revenue bands:
- $1–$1,000
- $1,000–$5,000
- $5,000–$25,000
- $25,000–$100,000
- $100,000+ [5]
As stores grow, their app stacks get deeper. The average store uses 6.1 apps, 12% use 10 or more, and high-growth stores often switch from Mailchimp to Klaviyo or add subscription apps [2][6].
sbb-itb-61169e3
How revenue trend shapes align with app adoption
App Adoption Sequence That Predicts Shopify Revenue Growth
App stack size by revenue tier
Revenue tiers map pretty cleanly to app stack depth. As a store makes more money, its app stack usually gets deeper too.
Stores under $10,000/month tend to run 5–10 apps. That usually means the basics: payments, a simple email capture tool, and one analytics integration.
Once a store moves into the $10,000–$50,000/month range, the stack often grows to 10–20 apps. At that point, you start seeing more structured email and SMS platforms, review apps, and at least one CRO tool.
In the $50,000–$250,000/month tier, stores often run 20–30+ apps. That’s where advanced segmentation, loyalty programs, and merchandising tools start to show up more often.
At $250,000+/month, stacks can go past 30–40 apps, especially when ERP integrations, custom apps, and advanced attribution tools are part of the mix.
Ecosystem-wide numbers support that pattern. Just 0.8% of Shopify stores run more than 20 apps, and 19.1% use zero apps at all [7]. So when you see a deep, structured stack, it stands out.
For agencies, that creates a useful signal. A mid-revenue store with a thin stack is often one of the best prospects: it has money coming in, but the systems behind that growth still look underbuilt. Filtering by revenue tier and app count makes those under-optimized accounts much easier to spot.
App categories that appear before revenue inflection points
The more useful signal isn’t app count alone. It’s which apps show up before revenue starts to move.
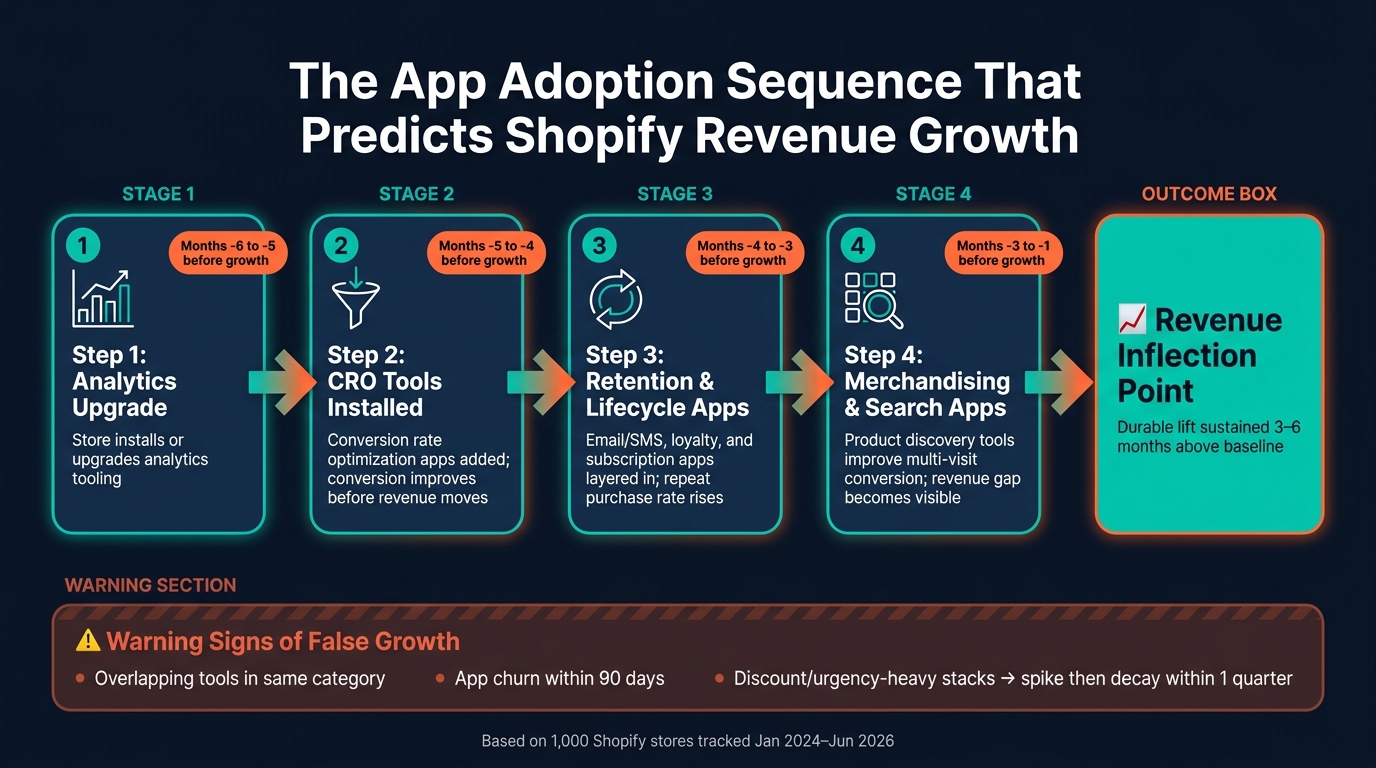
Three app categories appear again and again in the 3–6 months before a store’s revenue trend turns upward:
- CRO tools
- Retention and lifecycle apps, such as email/SMS, loyalty, and subscriptions
- Merchandising and search apps
The order matters too. Stores that install CRO tools first often improve conversion before the revenue line makes its move. Then retention apps help turn more first-time buyers into repeat customers, which pushes monthly revenue higher. After that, merchandising and search apps improve product discovery across multiple visits, and the revenue gap becomes easier to see over time.
The strongest growth cases in this dataset tend to follow a clear sequence: analytics upgrade → CRO implementation → retention build-out → merchandising refinement.
Stores that added CRO or retention apps in the last 30–90 days are often still in the middle of setup and rollout. That tends to be a sweet spot for agency support, because the timing lines up with execution needs.
When app adoption does not predict sustained growth
More apps don’t always mean a store is heading for steady growth. Sometimes the opposite is true.
Overlapping tools in the same category, heavy app churn within 90 days, or a stack packed with discount and urgency apps often points to testing without a clear plan. It looks busy on the surface, but the pattern is messy.
A common example is the store that gets a short-term lift from flash sale engines or aggressive countdown timers. Revenue jumps, then slips back to baseline within a quarter as margins get squeezed and customer trust starts to wear down.
Poor fit is another warning sign. Small stores that install enterprise CDPs or complex experimentation platforms they can’t fully use often end up with higher app costs and no matching lift in revenue.
For agencies, these signs matter. A store with a high app count, overlapping functions, and volatile revenue shapes may be a better fit for a lighter entry offer, like a stack audit or a single-channel project, instead of a full retainer. The pattern to watch is simple: durable lifts stay 3–6 months above baseline, while spike-and-decay curves fall back within one quarter.
Theme redesigns and signals that come before agency spend
Revenue changes around theme redesigns
Beyond app depth, redesign timing is one of the clearest outside signs that a store's budget may be opening up. Theme changes show up most often in the 50,000–200,000 monthly traffic range, which accounted for 1,080 of 1,703 changes over 120 days. Plus stores also changed themes at a 2.33% rate, compared with 1.22% for non-Plus stores [1].
The strongest clue is a move to a custom theme build. In that same 120-day period, "Custom" themes posted a net gain of 262 stores [1]. That kind of move usually points to a bigger design budget and a 2–4 month agency window. In plain English: when a merchant goes custom, design, CRO, or dev work often comes next.
Infrastructure and sophistication signals
Infrastructure changes can say more than a visual refresh. If a merchant swaps tools within the same app category - say, moving from one email platform to another - it often means they're done testing and ready to commit [8].
A Shopify Plus migration is another strong budget signal. It tends to show up 1–3 months before serious agency engagement [1].
A signal framework agencies can use to qualify prospects
A $2M–$10M store with 10+ apps and a recent Plus migration is a much stronger prospect than a store with one new install [6][2].
A simple way to size retainer room is to use 0.5%–1% of annual revenue as a ceiling. So a store doing $1M/year can often support a $5,000–$10,000/month engagement, while a store at $500K/year usually can't [6].
Use the table below to separate strong signals from noisy ones:
| Signal | Strength | Typical Lead Time | Likely Service Fit |
|---|---|---|---|
| Swap within the same app category (e.g., Mailchimp → Klaviyo) | Highest | Immediate | Migration / Specialist Retainers |
| Shopify Plus migration | High | 1–3 months | Full-service Agency / Infrastructure |
| Move to custom theme build | High | 2–4 months | Web Design / CRO / Dev Support |
| First-category app install (e.g., first review or support app) | Medium | 3–6 months | Implementation / Optimization |
Source: Signal Framework for Agency Qualification [6][1][8]
These are the strongest spend signals to bring into the final takeaways.
Conclusion: The revenue patterns worth tracking
Revenue trends don’t mean the same thing across every category or revenue tier. Store counts differ by category, and as Shopify stores climb the revenue ladder, their budgets change and so do the kinds of updates they make [3][6].
The clearest pattern is signal clustering. A single signal on its own doesn’t tell you much. App changes, pricing updates, and theme changes start to matter when they show up together as stores move into a higher revenue tier [9][6].
You can see the same thing in redesign timing. If you look at a short window, you’ll miss a lot. Theme changes move from 0.63% over 30 days to 1.99% over 120 days [1].
That matters for prospect qualification. Just 5% of Shopify stores bring in more than $1 million in annual revenue [10]. And the best prospects tend to show momentum in layers: mid-market traffic, Plus migrations, advanced tools like Klaviyo, and a shift from default themes to custom ones [1][6]. That mix, rather than any one signal by itself, usually comes before agency spend, signaling a need for a prospecting engine that converts [6][10].
FAQs
How can I tell if revenue growth is sustainable?
Don’t lean on one big spike. Look at 24–36 months of monthly revenue so you can tell the difference between repeatable seasonality and a one-time surge. It also helps to review monthly revenue share and quarterly year-over-year growth side by side.
Then check for steady momentum. That means stable traffic, conversion rate, and AOV baselines, active ads, and a deeper premium app stack. You should also look for clusters of changes that stick over 30–90 days - things like app or theme launches, hiring, or geographic expansion.
Which app changes matter most before a store grows?
The biggest app changes often mean the business is moving beyond day-to-day upkeep and starting to invest for growth. When a store adds tools built for growth, like subscription apps, loyalty platforms, or retention tools, that can signal a 60- to 90-day scaling window.
The same goes for core system upgrades. If a merchant moves to a stronger email platform like Klaviyo, it usually shows they’re putting money into their tech stack and may be getting ready to work with an agency.
What signals usually come before agency spend?
Common signals include:
- frequent product launches
- theme refreshes or redesigns
- major tech stack changes, such as adding growth tools like Recharge or Klaviyo
- hiring senior roles like a CMO or Head of Growth
- expanding into new regions
A jump in traffic, especially from 10,000 to 50,000 monthly visitors, can also signal that a merchant is ready to invest in outside expertise.