How To Track Shopify Competitor Revenue Signals
Estimate Shopify competitors' revenue from traffic, ads, apps, and pixels to prioritize outreach.

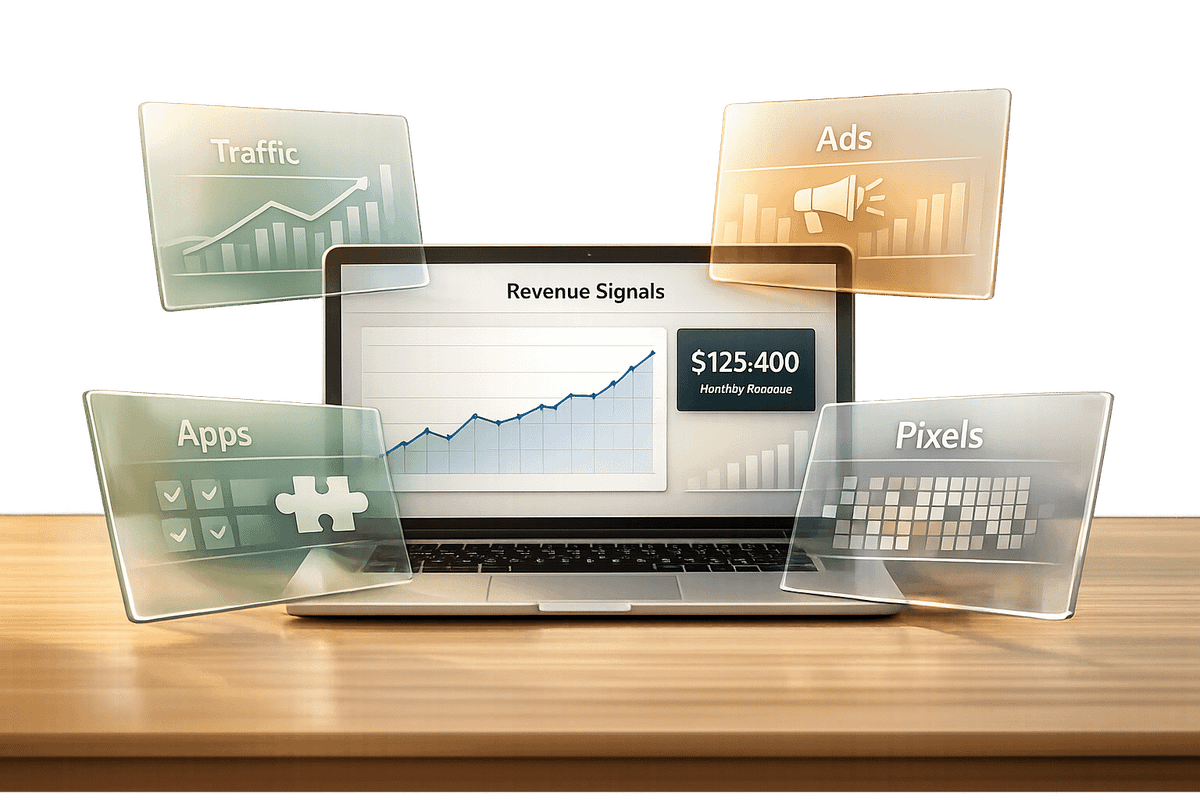
Want to know how your Shopify competitors are performing? Tracking revenue signals like traffic, ad spend, tech stack, and app usage can give you a clear picture of their growth, spending, and potential gaps. Instead of relying on guesswork, tools like StoreCensus analyze over 2.5 million Shopify stores, offering insights such as revenue tiers, app installations, and changes in digital strategies - all in real time.
Key Takeaways:
- Revenue signals estimate financial performance using traffic, ad activity, and tech stack complexity.
- Stores with 10,000–50,000 monthly visitors often generate $50K–$250K/month, making them great targets for agencies.
- Tools like StoreCensus help identify growth opportunities, such as high-traffic stores lacking key apps like Klaviyo or Rebuy.
- Tracking active ads, app installations, and Shopify Plus upgrades can reveal competitor strategies before they go public.
By analyzing these signals, you can focus your outreach by targeting the right Shopify stores, spot service gaps, and tailor your strategy for better results.
How to Check the Revenue of your Shopify Competitor

sbb-itb-61169e3
What Are Revenue Signals?
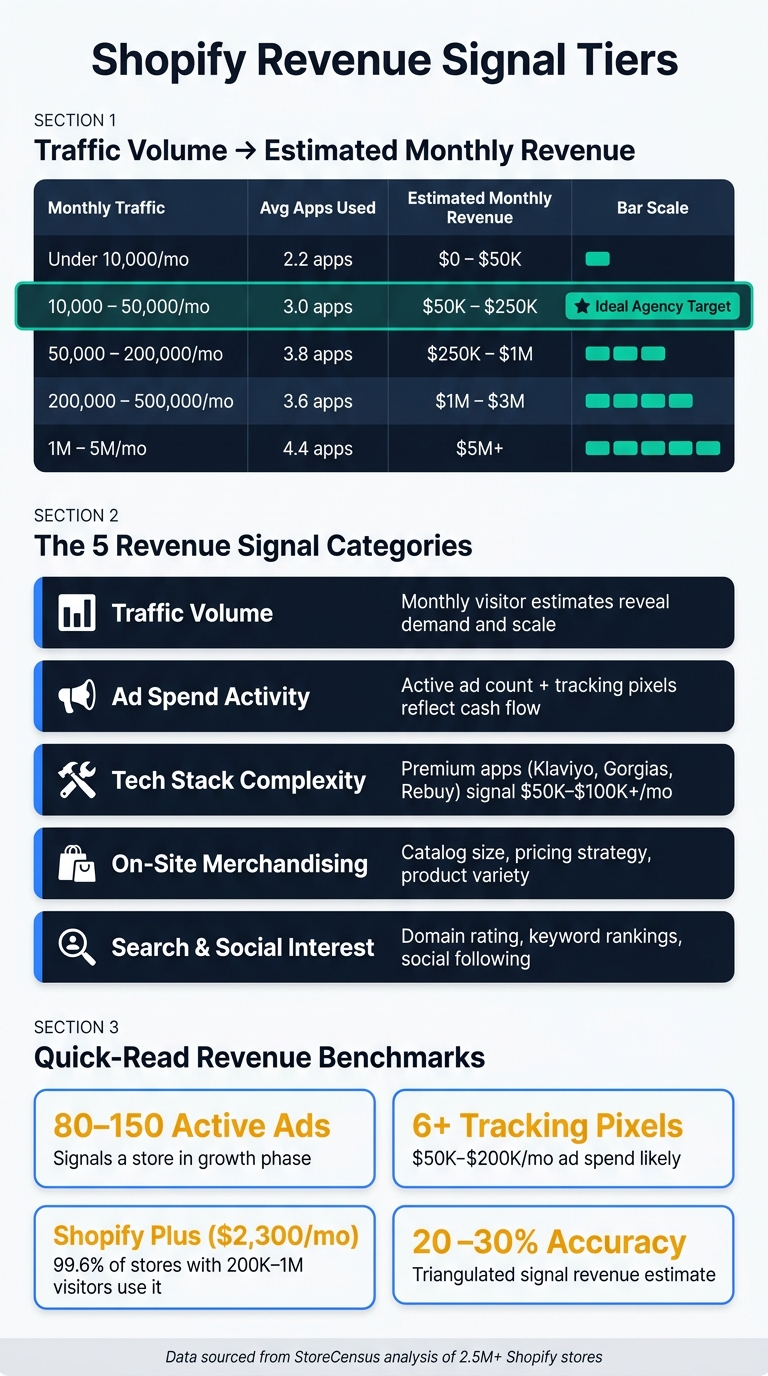
Shopify Store Revenue Signals: Traffic, Apps & Estimated Revenue Tiers
Revenue signals are data points that hint at a Shopify store's financial performance. Since Shopify doesn't share exact revenue figures, these signals act as indirect indicators, offering trends rather than precise numbers. By analyzing a combination of signals - such as traffic volume, ad activity, and tech stack complexity - you can estimate revenue within a 20–30% margin of accuracy.
Revenue Signal Categories
Revenue signals can be divided into five key categories, each shedding light on a store's financial health:
- Traffic volume: Monthly visitor estimates provide insight into a store's demand and scale. For example, a store with over 200,000 monthly visitors likely earns significantly more than one with 15,000 visitors.
- Ad spend activity: The number of active ads in platforms like the Meta or TikTok Ad Library, along with tracking pixels, reflects cash flow. A store running 80–150 active ads is often in a growth phase.
- Tech stack complexity: Stores using premium apps like Klaviyo, Gorgias, and Rebuy signal higher revenue levels. These tools typically make sense for businesses generating at least $50,000–$100,000 per month.
- On-site merchandising: Factors like catalog size, pricing strategies, and product variety reveal operational sophistication. Stores with well-rounded product offerings and strategic pricing often bring in higher revenue.
- Search and social interest: Metrics such as domain rating, keyword rankings, and social media following indicate long-term brand investment, which often correlates with steady revenue growth.
Here’s a quick look at how traffic levels align with app usage and estimated revenue:
| Traffic Tier | Avg Apps | Estimated Revenue Range |
|---|---|---|
| Under 10,000/mo | 2.2 | $0–$50k/month |
| 10,000–50,000/mo | 3.0 | $50k–$250k/month |
| 50,000–200,000/mo | 3.8 | $250k–$1M/month |
| 200,000–500,000/mo | 3.6 | $1M–$3M/month |
| 1M–5M/mo | 4.4 | $5M+/month |
These categories not only highlight financial health but also guide agencies in crafting more effective strategies using Shopify store guides.
How Revenue Signals Shape Agency Strategy
By understanding revenue signals, agencies can customize their outreach and services to better align with client needs.
"A $5M/year supplement brand has more in common with a $5M/year fashion brand than it does with a $200K/year supplement brand." - StoreCensus
Revenue tiers often predict factors like budget, decision-making speed, and operational readiness more accurately than industry type. For instance, stores with 10,000–50,000 monthly visitors - estimated to make $50k–$250k/month - are often ideal clients for agencies. These businesses typically have the resources to invest in services and faster decision-making processes led by founders.
Revenue signals also help agencies spot service gaps. For example, a store with high traffic but no advanced email marketing is a prime candidate for retention-focused services. This allows agencies to create tailored pitches rather than relying on generic outreach.
How to Build a Competitor Set
When analyzing competitors, it’s important to focus on Shopify stores that genuinely compare to your business or your clients. Random selections create unnecessary noise. By grouping stores based on meaningful similarities, the insights you gather will actually help drive decisions.
Types of Competitors to Track
Not all competitors are created equal. Tracking every store dilutes your data, so it’s crucial to focus on three key types that serve distinct purposes:
Direct competitors are those operating in the same niche, selling similar products at comparable prices. These are the brands competing for the same customers. Monitoring their ad strategies, tech tools, and traffic trends can uncover what’s working in your shared market.
Budget-adjacent stores might not sell the same products but operate within a similar revenue range. For example, a $5M/year supplement brand has more in common with a $5M/year fashion brand than with a $200K/year supplement brand. These stores are great benchmarks for understanding how businesses in the same revenue tier allocate budgets for technology, ads, and customer retention.
Aspirational brands are the high-revenue leaders - think Shopify Plus stores with over 1M monthly visitors. These stores often run advanced campaigns with 5+ tracking pixels. Only 1.4% of Shopify stores hit this traffic level. They offer a glimpse into market trends and what’s possible at the top tier of operations.
Using StoreCensus to Build a Competitor List
StoreCensus is a tool that simplifies competitor research, allowing you to filter and build a targeted list in minutes. Instead of spending hours on manual research, you can create a precise, exportable competitor set.
Here’s how to refine your competitor list using StoreCensus:
- Select a revenue tier: Start with a range that aligns with your goals. For example, if you’re prospecting for agencies, the $100K–$1M range is ideal. These stores typically have real budgets and move faster than larger enterprises.
- Narrow by country and category: Focus on the United States and your target vertical, like Beauty or Apparel. Tech investments vary by category - Beauty stores, for instance, average 2.3 apps per store compared to 1.5 for hobby or automotive stores.
- Filter by tech stack: Use app-based filters to find stores with specific characteristics. For example, you could search for "US-based Beauty stores doing $1M–$5M using Klaviyo but not Rebuy" to identify a segment with a clear service gap.
- Export or sync: Once your list is ready, export it as a CSV or sync it with Apollo to add decision-maker contact data.
After building your list, set up a Watchlist in StoreCensus to receive weekly updates. These digests track changes like revenue shifts, new app installations, or theme updates. For example, if a competitor installs a subscription app or upgrades to Shopify Plus, it signals significant changes - often before a press release.
Keep your competitor set focused - 20 to 50 stores is an ideal range for actionable insights. This approach lays the groundwork for effective revenue signal tracking, which we’ll explore further in the next section.
How to Track Revenue Signals
Once you've identified your competitors using a list of top Shopify stores, the next step is to decode the signals they broadcast daily. By combining a few key indicators, you can get a reasonably accurate picture of their performance.
Traffic and Demand Signals
Traffic volume is the easiest place to start. While estimation tools can have a 20–40% margin of error, using at least two sources and averaging their data will give you a solid baseline. For stores with less than 100,000 visits per month, treat these estimates as directional rather than precise.
But it’s not just about how much traffic a store gets - it’s about the type of traffic. For example:
- If direct traffic makes up 60% or more, it suggests strong brand loyalty and repeat customers.
- If paid search traffic exceeds 40%, the brand is likely in aggressive acquisition mode. This often signals a healthy ad budget but potentially tighter margins.
Use the table below to roughly estimate revenue based on traffic:
| Monthly Traffic | Estimated Monthly Revenue |
|---|---|
| Under 10,000 | $0–$50,000 |
| 10,000–50,000 | $50,000–$250,000 |
| 50,000–200,000 | $250,000–$1,000,000 |
| 200,000–500,000 | $1,000,000–$3,000,000 |
| 1,000,000–5,000,000 | $5,000,000–$15,000,000 |
Another key indicator is review velocity - the number of new reviews a store gets each month. Roughly 5–8% of customers leave reviews. So, if a store collects 50 new reviews in a month, it likely processed 625–1,000 orders during that time. Multiply this by the store's average order value (AOV), and you’ll have a working revenue estimate without needing expensive tools.
From here, dig deeper by analyzing ad spend and merchandising strategies.
Ad Spend and Merchandising Signals
The Meta Ad Library is a goldmine for competitor research and completely free. Look up your competitor and note their active ad count. If they’re running 50 or more creatives, they’re likely spending at least $50,000 per month on ads. Pay attention to how long their campaigns have been active - ads running for six months or more are usually tied to profitable, high-performing products.
"Running ad count plus creative variety in the ad library is the single most underused DTC revenue signal." - Larry, AdLibrary
Pixel usage also reveals ad budget scale. Stores with 1–3 tracking pixels are likely spending minimally, while those using 6 or more - like Meta, TikTok, Pinterest, Snapchat, and Google - are spending $50,000–$200,000 per month. If they’re running ads across markets like the US, UK, Australia, and Canada, their revenue likely exceeds $500,000 monthly.
On the merchandising side, the size and structure of a store’s catalog can provide clues. A store with 500+ products or 20+ collections is operating at a mature scale. Sorting their collection page by "Best Selling" can reveal which products are driving the bulk of their revenue.
Tech Stack and App Signals
A store’s tech stack can also hint at its revenue. Many apps cost $300–$500 per month, so their presence signals financial health. For example:
- Using Gorgias often correlates with $50,000+ in monthly revenue.
- Apps like Rebuy or Elevar suggest revenue in the $100,000–$200,000+ range.
Shopify Plus membership is another clear indicator. With plans starting at $2,300 per month and 99.6% of stores in the 200,000–1,000,000 monthly visitor range using it, being on Shopify Plus strongly implies significant revenue.
The number of apps a store uses also scales with its revenue. For example:
- Stores with under 10,000 monthly visitors average 2.2 apps.
- Stores in the 1,000,000–5,000,000 visitor range average 4.4 apps.
A sudden increase in app count can signal strategic shifts. For instance, adopting tools like Recharge (subscriptions) or Attentive (SMS) often indicates efforts to improve retention and boost customer lifetime value - sometimes weeks before the brand makes any public announcements.
"We noticed a competitor's revenue band dropped two months before they started discounting heavily. StoreCensus basically gave us a leading indicator." - Head of Growth, DTC Brand
To get the most accurate revenue estimate, triangulate three signals: traffic (multiplied by conversion rate and AOV), ad spend (based on creative volume and pixel count), and review velocity (multiplied by AOV). This approach will typically place your estimate within 20–30% of the actual figure, giving you actionable insights for strategic decisions.
Building a Repeatable Revenue Tracking System
Having a reliable tracking system in place can turn scattered bits of information into a steady stream of insights that help you stay ahead of the competition. While a one-time effort to gather data can be useful, consistently monitoring and analyzing signals - say, every two weeks - can drive long-term growth for your agency.
How to Structure a Revenue Signal Dashboard
Start with a central spreadsheet where each row represents a competitor. Track essential metrics like monthly traffic tier, ad count, pixel count, key app usage, Shopify Plus status, and revenue band. This setup gives you a clear and consolidated view of the most important proxy metrics.
Make it a habit to update this dashboard every other Monday. Spend 20–30 minutes reviewing changes in ad counts and new app installations. Over time, this log will evolve into a timeline of your competitors’ strategic moves, often revealing key shifts before they become public knowledge. Use this timeline to spot changes in revenue bands and adjust your strategy accordingly.
Add a column to indicate revenue band direction - whether a store is growing, staying steady, or shrinking. For instance, if a store drops from the $1M–$5M revenue band to the $500K–$1M band, it could signal upcoming discounting or even a major strategic shift.
If keeping up with manual tracking becomes overwhelming, it’s time to consider automation.
Automating and Prioritizing with StoreCensus
Manual tracking has its limits, especially as your data grows. Automation tools like StoreCensus can help. This platform scans over 2 million Shopify stores weekly, identifying changes in app installations, revenue bands, theme updates, and pixel counts - often within just 7 days of a shift.
With StoreCensus, you can create a watchlist of competitors by domain or store name. Every Monday, you’ll get an automated summary of all changes across your selected stores. One Ecommerce Director shared:
"The weekly change emails are the first thing I read on Monday morning. It takes 5 minutes to know everything that shifted in our competitive landscape."
For agencies, these insights are invaluable for both prospecting and competitive intelligence. The Lead Fit Score (ranging from 0–100) is particularly useful. It evaluates stores based on their tech stack, app count, pixel count, and revenue signals, removing the need for manual scoring. For example, in the $500K–$2M revenue band, 84.3% of stores with a Lead Fit Score of 80 or higher are reachable. Filtering by this score, alongside revenue tiers, helps you prioritize targets effortlessly.
Once you identify a store that fits your criteria, export Shopify brand prospect lists with key details like domain, estimated revenue, app count, pixel count, and Lead Fit Score. For stores in the $2M–$10M range, it’s best to target the CMO or Head of Growth. For stores under $2M, your outreach will likely start with the founder. By integrating these steps into your tracking system, you’ll maintain a sharp edge in your competitive landscape.
Conclusion: Turning Revenue Signals into Agency Growth
Using public data effectively can help you make smarter choices about who to target and when. Agencies that grow steadily aren’t just the most creative - they’re the ones that consistently attract clients who value and can afford expert services.
By leveraging data insights, you can focus on qualifying revenue tiers to guide your outreach strategy. Why is this so important? Because revenue tier serves as a powerful filter. As highlighted:
"The difference between a struggling agency and a thriving one isn't creativity, positioning, or even results. It's client quality. And client quality starts with one thing: revenue."
For example, a $5M Shopify brand has more in common - like larger budgets and quicker decision-making - with another $5M brand than with a $200K brand.
To act on these signals, integrate them into an automated tracking system. Keep an eye on app installs, revenue shifts, pixel counts, and tech stack updates to identify growth indicators - like a store moving to a higher revenue tier or installing Klaviyo - so you can reach out at the right time. Tools like StoreCensus simplify this process, scanning over 2.5 million Shopify stores weekly and providing alerts and a Lead Fit Score to help you focus on the best opportunities.
Start by defining your competitor set, setting up your dashboard, and conducting your first weekly review. Over time, these insights become a major competitive edge. With tools like StoreCensus, you can turn raw data into a system that powers your agency’s growth.
FAQs
Which revenue signals are the most reliable to track first?
When it comes to tracking revenue potential, the most dependable metrics are traffic levels, conversion rates, and average order value (AOV). These three provide a solid starting point for estimating monthly revenue. From there, you can fine-tune your projections by factoring in additional data, such as advertising performance and spending on your tech stack.
Another critical indicator is app usage. Stores generating higher revenue often rely on premium tools to optimize their operations. Tools like StoreCensus make it easier to keep tabs on these real-time signals, including app installations and shifts in revenue bands, offering a clearer picture of your growth trajectory.
How can I estimate a competitor’s revenue without paid tools?
To get a rough estimate of a competitor's revenue without spending a dime, you can create a proxy model using publicly available data. Here's how:
- Estimate their monthly traffic: Tools like SimilarWeb can give you an idea of how many visitors their site gets each month.
- Determine their conversion rate: Use a realistic range for their industry, typically between 1.5% and 4.9%. This is the percentage of visitors likely to make a purchase.
- Calculate their Average Order Value (AOV): Look at the prices of their top products and take an average. This gives you an idea of how much a typical customer spends per order.
Once you have these numbers, plug them into this formula:
Revenue = Traffic × Conversion Rate × AOV
For a more accurate estimate, cross-check this with other indicators like their tech stack or advertising activity. These can provide additional insights into their business scale and spending patterns.
How often should I update my competitor revenue dashboard?
Keeping your competitor revenue dashboard updated on a weekly basis is key to staying informed without overwhelming yourself. StoreCensus updates its revenue estimation models every week, tracking essential changes like app installations, technology updates, and shifts in revenue bands.
While you always have access to historical data, reviewing weekly ensures you spot meaningful changes in your competitors' performance or strategies. This approach helps you maintain accurate, actionable insights without the hassle of daily monitoring.