
Exponential Smoothing vs ARIMA for Store Revenue
Default to exponential smoothing for fast, low-effort store revenue forecasts; test ARIMA on clean, longer histories and use holdout error.


If I need a usable store revenue forecast fast, I start with exponential smoothing. For most agency teams working across Shopify and WooCommerce accounts, it takes less setup, needs less tuning, and holds up better when data is short or noisy.
Here’s the short version:
- Exponential smoothing is usually the best default for agency use.
- ARIMA can do more with lagged patterns and post-shock behavior, but it often takes more setup and testing.
- Ecommerce revenue is messy: weekly swings, Q4 spikes, campaign jumps, and tracking gaps can all throw forecasts off.
- A store might move from $60,000 to $110,000 in monthly revenue, then hit $180,000 in November. That kind of jump is common, and not every model handles it well.
- The smart move is simple: hold out a recent period, test both models, and keep the one with lower forecast error.
If I’m working across many accounts, I don’t want a model that eats up hours every time data shifts. I want one my team can run, check, and use without a long review cycle. That’s why exponential smoothing usually comes first, while ARIMA fits a smaller set of stores with cleaner history and a stronger case for deeper model work.
Time series forecasting in ML (ARIMA, Holt-Winters)
sbb-itb-61169e3
Quick Comparison
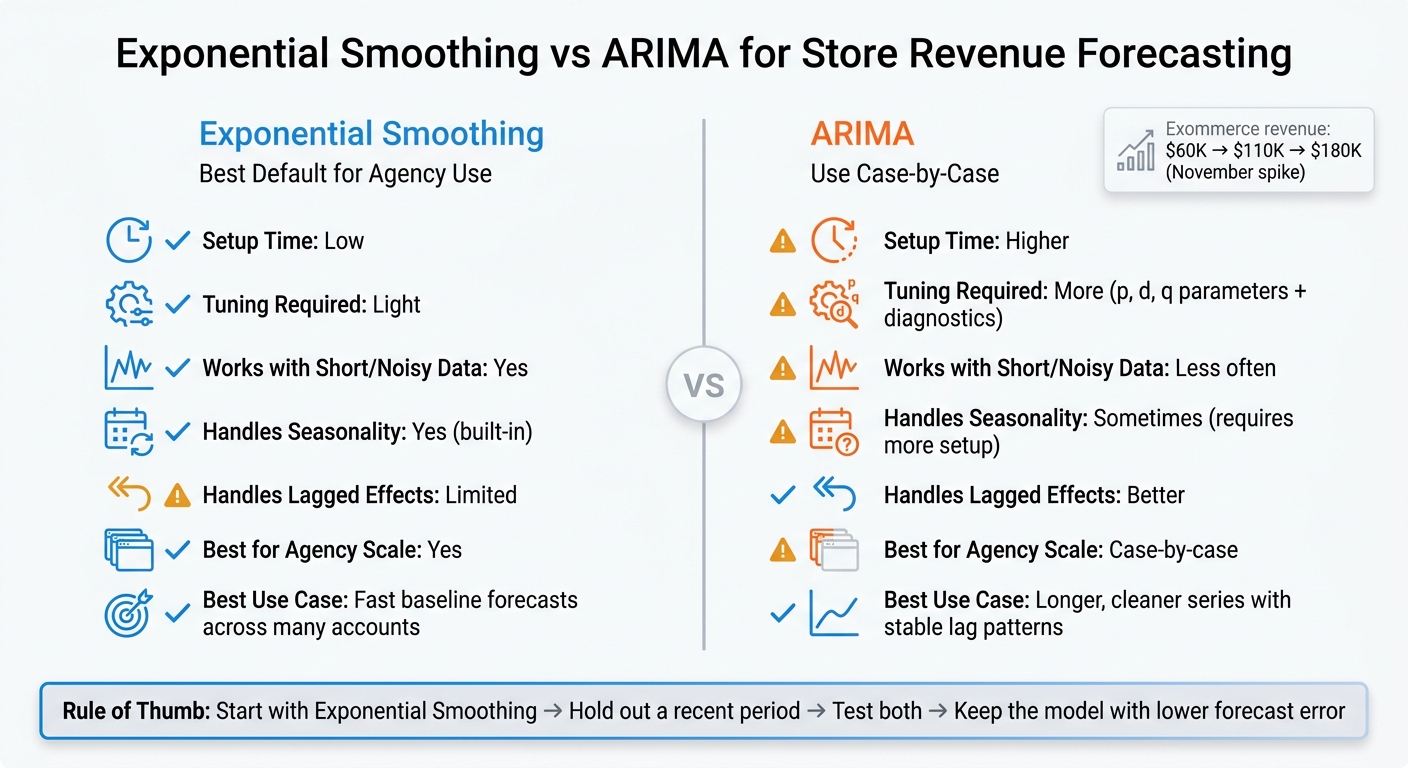
Exponential Smoothing vs ARIMA: Agency Forecasting Comparison
| Criteria | Exponential Smoothing | ARIMA |
|---|---|---|
| Setup time | Lower | Higher |
| Tuning needed | Light | More |
| Works well with short/noisy data | Yes | Less often |
| Handles seasonality | Yes | Sometimes, with more setup |
| Handles autocorrelation and lagged effects | Limited | Better |
| Best for agency scale | Yes | Case-by-case |
| Best use case | Fast baseline forecasts | Longer, cleaner series with stable lag patterns |
My rule of thumb: start simple, test both only when needed, and let holdout error decide.
How Exponential Smoothing Works for Store Revenue
Exponential smoothing puts more weight on recent revenue as fresh data arrives. In agency work, that makes it most useful when the main drivers stay fairly steady and show up clearly in the numbers. For agencies, the upside is simple: a fast baseline forecast you can reuse across accounts.
What Exponential Smoothing Captures Well in Shopify and WooCommerce Revenue
This method works well when revenue follows a recurring seasonal pattern. If a store tends to jump in Q4 or moves in a steady month-to-month cycle, exponential smoothing can follow that pattern without much fuss. It’s also a good fit for subscription revenue and repeat-purchase revenue, where buying behavior tends to repeat.
Data Requirements, Preprocessing, and Setup Time
Raw exports won’t cut it. Pull data from Shopify Analytics exports, payment-processor statements, and bank statements. Then net gross sales for refunds, chargebacks, discounts, and fees to calculate realized revenue.
Once the revenue series is clean, exponential smoothing is pretty quick to set up. Seasonal stores need enough history for the model to learn what normal monthly swings look like.
Where Exponential Smoothing Falls Short
This approach leans on steady history and recurring patterns. It starts to lose steam when revenue changes after a structural break, like a pricing change or a shift in channel mix. That’s the point where ARIMA deserves a closer look.
How ARIMA Works for Store Revenue
ARIMA links current revenue to past revenue and past forecast errors. In plain English, it looks backward to explain what’s happening now. It tends to work best when those lagged patterns stay steady enough to project forward. That matters most when an agency needs a forecast that explains repeated movement, not just a clean trend line.
What ARIMA Can Model Better Than Simpler Methods
ARIMA can handle autocorrelation, delayed effects, and post-shock patterns better than a simple trend model.
Why ARIMA Takes More Time to Set Up Correctly
ARIMA needs the revenue series to be stable enough for the model to perform well. Store revenue often moves up over time as a business grows, so teams use differencing, the d setting, to steady the series. Then the work keeps going. Teams still need to test p and q, usually by checking autocorrelation plots and comparing model fit across options.
That extra setup is the tradeoff. You can get a stronger fit, but only after more testing and model checks.
When the Extra Modeling Work Is Worth It
Use ARIMA when the store has enough clean history, patterns that hold up over time, and a clear reason to model lagged effects more precisely than exponential smoothing allows.
That leads to the main agency question: does ARIMA’s extra work pay off often enough to beat a faster default?
Exponential Smoothing vs ARIMA: Side-by-Side for Agency Teams
Once the revenue series is cleaned, the next step is simple: pick the model that turns that data into a forecast with the least friction.
For agency teams, this choice isn't only about model quality. It's also about how much cleanup, tuning, and review each method needs before anyone can put the forecast to work.
Forecast Accuracy in Real Agency Use Cases
Seasonal stores are tough to forecast because one month rarely reflects the full year [1]. That's a big deal for agencies that need forecasts they can use across many accounts, not just on one neat, tidy series.
Exponential smoothing works well when revenue follows recurring seasonal patterns, and it does that without extra tuning. ARIMA can model lagged effects with more precision, but there's a catch: it usually needs diagnostic checks first to confirm the series is stable enough to use.
Data and Workflow Tradeoffs by Team Size
Exponential smoothing tends to fit small teams because it asks for less tuning. ARIMA makes more sense for teams that have time for diagnostic checks and model selection.
Standardizing revenue reconciliation gives both methods cleaner input, which helps. But it doesn't remove the setup-time gap between them. And for agency teams, that gap often shapes the default workflow more than anything else.
Recommendation: Default to Simplicity, Then Test Before Scaling
When you compare model fit with setup cost, the practical rule is pretty clear: start with exponential smoothing. Forecasts are estimates to begin with, so it makes sense to keep setup time low unless ARIMA shows better results on holdout data. Put simply, test ARIMA only when the drop in holdout error is enough to justify the extra work.
A Forecasting Workflow Agencies Can Standardize
A simple workflow works well here: hold out the most recent period, score both models on forecast error, and use the model with the lower error.
You can also use merchant segmentation to decide where deeper testing is worth your team's time. Not every account needs the same level of modeling.
How StoreCensus Can Improve Merchant Selection for Forecasting
Use StoreCensus to target Shopify stores by revenue, tech stack, country, and growth signals before deciding whether an account deserves ARIMA. Higher-traffic stores tend to justify deeper modeling more often. Even so, you should still validate against a holdout period before treating the forecast as reliable.
Key Takeaways
- Default to exponential smoothing. It’s faster to deploy, easier to standardize, and usually strong enough for agency forecasting.
- Validate before escalating. Hold out a recent period and run both models. Use the lower-error model, not the more complex one.
- Tier your accounts. Use StoreCensus to spot merchants with stronger growth signals and tech stacks. Those are the accounts where ARIMA-level work is worth the time.
FAQs
How much historical revenue do I need?
For basic forecasting, most tools need 3–12 months of sales data to make predictions you can trust. If you only have 90 days, some models can still give you a read on demand, but results usually get better as more history comes in.
If you want insight at the SKU level, try to gather at least 6 months of data. That gives the model more to work with and helps you avoid reading too much into short-term swings.
To spot peak months, slow quarters, and longer growth patterns, 24–36 months is the better target. And if you have less than 3 months of history, it usually makes more sense to lean on industry benchmarks and your marketing spend instead.
When should I switch from exponential smoothing to ARIMA?
Switch to ARIMA when your forecasting job gets more involved than exponential smoothing can handle. Exponential smoothing often works well for simpler forecasts. ARIMA is a better fit when your data shows stable, steady trends and you need a model that can deal with that extra complexity.
A good time to make the move is when your store starts growing and your data needs more careful analysis. This matters even more once you have enough history to work with - ideally a year or more - so your revenue forecasts have a stronger base.
What holdout period should I test on?
Use a holdout period that lines up with your forecast horizon and spans at least your longest supplier lead time, plus a safety buffer. For example, if your lead time is 90 days, a 120-day holdout period is a solid choice.
For input data, most models need 3–12 months of sales history. Some can work with 90 days, but 6 months is usually the minimum if you want a steady read on SKU-level demand patterns and seasonality.