2026 AR Commerce Report: Mobile Shopify Trends
Data-driven overview of mobile AR on Shopify: where it's used, conversion impact, implementation paths, and agency outreach signals.

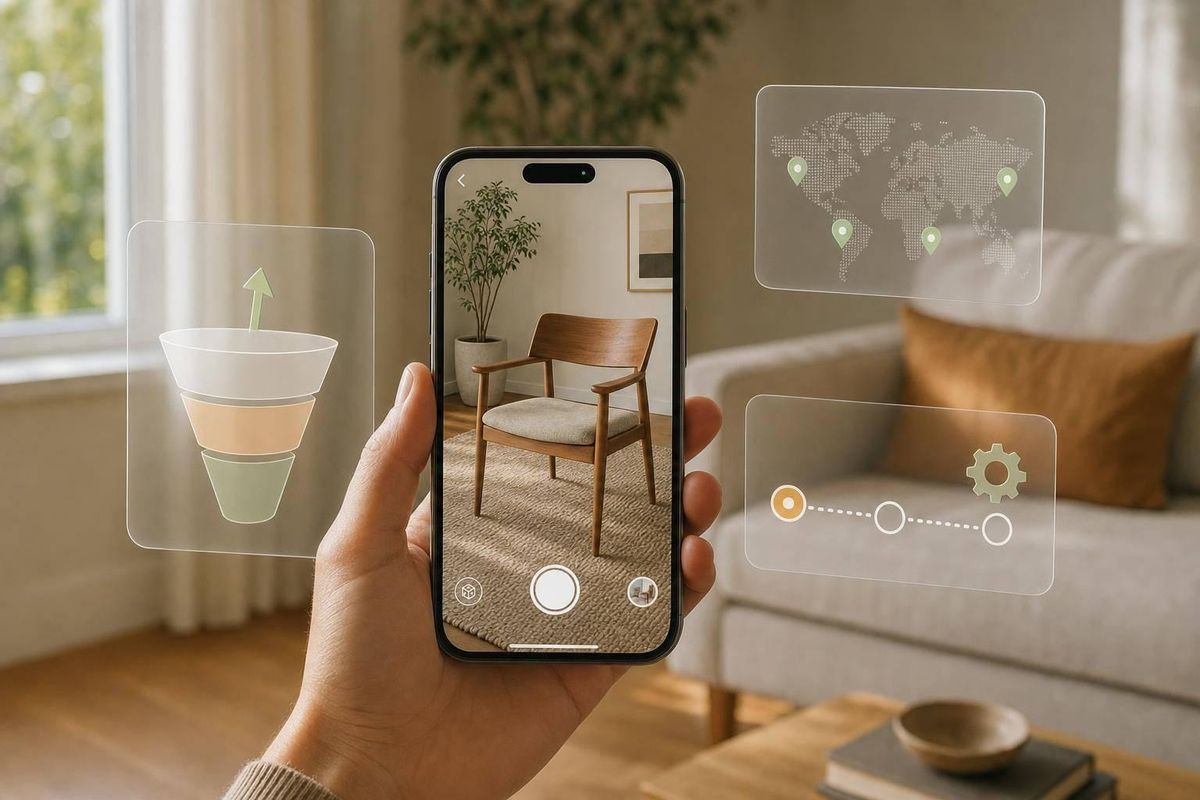
Mobile AR on Shopify is now a buying signal, not just a product feature. As of August 31, 2026, AR adoption is led by Arty – 3D model viewer with 147,384 active installs, and AR shows up most often in stores with heavier app stacks and more spend on product pages.
Here’s the short version:
- AR is mostly a mobile PDP tool used to cut buyer doubt around fit, size, placement, and appearance
- It shows up most in categories like home decor, beauty, fashion, and jewelry
- Stores using AR often have 10+ apps, which points to more spend on design, CRO, and paid media
- Results can be strong: +40% conversion, 5% fewer returns, 65% higher purchase rate, and 2.7x higher conversion in some try-on cases
- The best near-term markets are the U.S., U.K., Canada, and high-use MENA markets like Saudi Arabia and the UAE
- On Shopify, AR usually comes through GLB/USDZ 3D assets, viewer apps, try-on apps, or room visualizers
If I were sizing up AR merchants, I’d look for a simple mix of signals:
- Category fit: products where shoppers need help judging what they’re buying
- Stack depth: stores with 10+ apps
- Market demand: countries where AR shopping use is already higher
- Implementation level: basic 3D viewer vs. try-on flow vs. room visualizer
- Spend clues: Advanced ($399/month) or Plus ($2,300+/month), retention tools, and pixel setup
| Signal | What it usually means |
|---|---|
| 3D viewer installed | The merchant is putting money into PDP quality |
| Try-on or room visualizer | Higher setup cost and stronger buy-in |
| 10+ apps | More mature store stack |
| Meta + TikTok pixels | Paid acquisition is already in place |
| Home, beauty, fashion, jewelry | AR use case is easier to justify |
In other words: AR on Shopify often points to stores that are easier to sell services to. Not because AR alone matters, but because it tends to show up where the team already cares about mobile conversion, product presentation, and ad performance.
That’s the lens I’d use for the rest of this report.
How To Use Augmented Reality (AR) & 3D Models in Shopify
sbb-itb-61169e3
Mobile AR commerce in 2026: what the data shows
The Product variants category now has 432,026 active installations across 2.17 million tracked stores.[1] That’s not a small corner of Shopify.
Adoption tends to show up in more complex stores, especially merchants running 10 or more apps. That group makes up 12% of Shopify merchants.[1] In plain English: AR usually appears in stores that already invest more in their stack. And that matters most on the mobile product page, where shoppers are trying to figure out one simple thing: Will this work for me?
Where AR fits into the buying journey
AR has the biggest impact during the consideration stage on mobile PDPs, when shoppers are sizing up fit, look, and use. It’s less about novelty and more about reducing doubt.
The results back that up. Gunner Kennels saw +40% order conversion and a 5% reduction in returns after adding 3D/AR crate visualization.[11][13] Rebecca Minkoff found that shoppers who viewed a product in AR were 65% more likely to purchase.[10][12][13] In fashion and beauty, AR try-ons have delivered 2.7x higher conversion than static images.[5][8][9]
Those gains don’t just point to better shopper experience. They also hint at something else: these are often stores already putting money into design, testing, and page-level conversion work.
Why this matters for Shopify agencies
For Shopify agencies, AR can act like a buying signal. Stores using AR are often investing more heavily in product assets, PDP optimization, and conversion tracking.[6][7][8]
That usually makes them more open to work like:
- mobile-first PDP redesigns
- structured content systems
- A/B testing programs
There’s also a paid media angle. The same 3D assets used for AR can support ad creative, and AR-enabled landing pages can beat static pages.[5][8][9]
So when an agency looks at AR adoption, three signals stand out: design maturity, CRO sophistication, and paid media readiness. That pattern is easiest to spot when you break it down by category.
Category adoption on Shopify: where AR is most common and why
Shopify app data shows AR usage is heavily concentrated in Product variants, with 432,026 active installs [1]. That makes sense. AR tends to show up where shoppers hesitate because they can’t judge something well from a flat image alone.
The pattern is pretty clear: AR is most useful when a product creates visual uncertainty around fit, size, placement, or appearance. When buyers need help picturing how something will look or work in their own life, AR starts to earn its keep.
Furniture and home decor: why placement and scale drive AR use
In Home & Garden, there are 247,439 stores [3]. Here, the friction is mostly spatial. A sofa might look great in a product photo but still feel too large, too small, or just off once it’s in the room.
That’s where AR helps. It gives shoppers a way to check scale and placement before they buy. For agencies, this group is often worth a closer look too. These merchants are more likely to care about product-page quality, invest in assets, and test for conversion gains. In plain English: they’re often a good fit for design work and CRO services, making them ideal targets for Shopify store prospecting.
Beauty, fashion, and accessories: fit and appearance use cases
Fashion & Apparel is Shopify’s largest vertical, with 282,254 stores [3]. The friction here is just as easy to spot: fit, drape, and how an item looks on the body.
Beauty & Personal Care brings a similar problem from a different angle. Shoppers want help with shade matching and appearance checks. This category also stands out because stores average 4.8 apps per store, one of the highest app densities across Shopify verticals [3].
The same pattern shows up across a few categories:
- Fashion & Apparel: buyers want more confidence around fit and style
- Beauty & Personal Care: shade and appearance matter at the point of purchase
- Jewelry & Accessories: scale, style, and how an item looks when worn matter
Jewelry & Accessories has 112,720 stores and averages 4.1 apps per store [3]. Across all three categories, the story is similar. Shoppers want more confidence before they click buy, and these merchants already tend to run heavier app stacks. AR helps narrow the gap between what a shopper expects and what shows up in the box.
Where AR is hard to justify: low-consideration products
That logic starts to fall apart in categories where shoppers don’t need help with fit or spatial judgment. Digital Goods stores average 2.8 apps per store, while Books & Media averages 3.0 [3].
That gap matters. Books, media, and digital goods don’t usually come with the kind of visual uncertainty that makes 3D asset production worth the time or cost. If a product doesn’t need placement, scale, fit, or appearance checks, AR is a much harder sell.
These category trends also help point to the merchants most likely to spend on design, CRO, and paid media next.
Country patterns and app stack signals: where demand is strongest and how merchants build AR
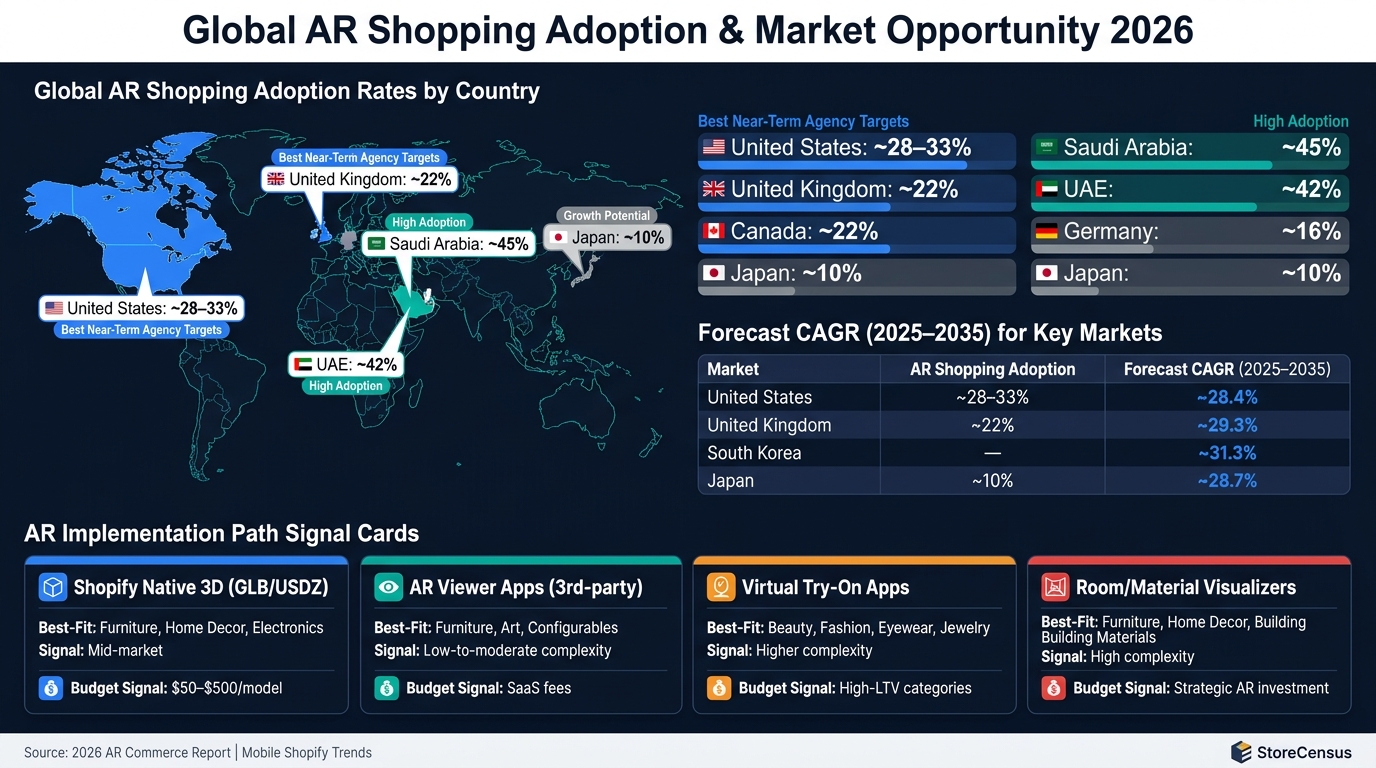
Global AR Shopping Adoption & Market Opportunity 2026
Not every market is in the same place with AR shopping. That matters more than people think.
Category fit tells you what AR can help sell. Market maturity tells you where it can sell right now. If you're pitching AR services, that changes the angle, the offer, and the budget conversation.
Country comparison: AR adoption by market
The United States is still the lead market, with 28–33% of shoppers already using AR while shopping online [19][21][20]. The United Kingdom and Canada are both at about 22% adoption [19].
Other markets are behind for now. Germany is at roughly 16% [19], where trust and privacy concerns shape how AR needs to be framed. Japan is around 10% [19]. That said, its forecast CAGR of 28.7% through 2035 [18] suggests more room ahead than the current adoption figure might imply.
MENA stands out. Saudi Arabia sits at about 45% and the UAE at about 42% [19][21], which puts them among the busiest AR shopping markets in the world.
| Market | AR Shopping Adoption (2025) | Forecast CAGR (2025–2035) | Best Agency Focus |
|---|---|---|---|
| United States | ~28–33% [19][21][20] | ~28.4% [18] | Conversion, CRO, paid media |
| United Kingdom | ~22% [19] | ~29.3% [18] | Conversion + UX optimization |
| Canada | ~22% [19] | - | Targeted CRO experiments |
| Germany | ~16% [19] | - | Awareness, trust-building |
| Japan | ~10% [19] | ~28.7% [18] | Engagement, immersive awareness |
| South Korea | - | ~31.3% [18] | Aggressive conversion, social commerce |
| Saudi Arabia / UAE | ~42–45% [19][21] | - | Early testing, flagship pilots |
For near-term outreach, U.S. and U.K. merchants are usually the best fit for conversion-led pitches. CAGR data helps spot markets where getting in early may pay off later.
Shopify AR implementation paths: native 3D, try-on apps, and room visualizers
Once a market is ready, the next signal is the build path. That usually tells you how far a merchant has already gone with AR.
Furniture and home decor stores often lean toward native 3D and room visualizers. Beauty and fashion brands tend to lean toward try-on. Different stack, different budget, different level of buy-in.
Shopify native 3D runs on GLB/USDZ uploads. From there, most setups fall into a few buckets: embedded AR viewer apps, virtual try-on apps, and room or material visualizers.
| Implementation Path | Best-Fit Categories | Production Complexity | Budget Signal |
|---|---|---|---|
| Shopify native 3D (GLB/USDZ upload) | Furniture, home decor, electronics | Moderate ($50–$500/model) [17] | Mid-market; investing in assets, not apps |
| AR viewer apps (3rd-party, embedded) | Furniture, art, configurables | Low-to-moderate; some apps generate models | Comfortable with SaaS fees and a more involved workflow |
| Virtual try-on apps | Beauty, fashion, eyewear, jewelry | Higher; needs calibration and camera UX [15][17] | Higher-LTV, higher-AOV categories |
| Room/material visualizers | Furniture, home decor, building materials, wall art | High; requires reliable 3D or AI overlays [14][16][17] | High-ticket categories; strategic AR investment |
This is one of the clearest merchant signals you can get. A store that uploads 3D assets is saying one thing. A store running calibrated try-on flows is saying something else entirely.
Using StoreCensus to find AR-ready merchants
StoreCensus can help you narrow the field fast. Filter for merchants by country, category, app count, and installed 3D or try-on apps.
A good place to start:
- U.S. and U.K. stores
- Home & Garden and Beauty & Personal Care
- Stores with 10+ apps
- Stores using retention tools like Klaviyo
Those signals help you sort merchants by AR readiness and build a sharper outreach list.
What mobile AR adoption signals about merchant spend readiness
AR is a budget signal. When a merchant pays for 3D or try-on tools, they’ve already spotted a conversion issue and put money behind fixing it. In most cases, that shows up first in the depth of the app stack, then in how the store tracks conversion.
AR adoption as a signal for design and CRO demand
AR adopters tend to cluster in the 12% of stores with 10 or more apps [1]. That points to a more mature operation. When a merchant installs its first 3D viewer or try-on app, it usually means the basics are already in place and the team is now working on a specific conversion problem [4].
That often goes hand in hand with a stronger PDP structure, faster-loading assets, and more testing. In plain English: this usually isn’t a beginner store still patching holes. It’s a store trying to squeeze more from traffic it already has.
Shopify plan tier adds another clue. Merchants on Advanced ($399/month) or Plus ($2,300+/month) point to higher spend capacity [2]. Add an AR app on top of that, and the picture gets clearer: this merchant is putting money into the mobile shopping experience and likely has room to spend more.
That same level of maturity often shows up on the acquisition side too.
What paid media agencies should read into AR implementation
AR assets don’t just help on-site conversion. They can also feed ad creative and retargeting. A merchant running a try-on flow or room visualizer is often more mature from an operations standpoint, but the clearest paid media signal is measurement maturity.
TikTok Pixel adoption grew by 28% in 2026 [2]. And merchants running both Meta and TikTok Pixels are already working across multiple acquisition channels at meaningful spend levels [2].
For paid media agencies, the signal isn’t the AR feature by itself. It’s what that spend says about the business behind it. These merchants usually have:
- Visual-first assets
- A mobile-aware audience
- Internal buy-in to fund richer acquisition and retargeting flows
There’s also a direct budget clue here. Stores spending $800+/month on apps have already shown they’ll pay for software and services [2].
Taken together, these signals help separate casual interest from real spend readiness.
Conclusion: the signals that matter most
Adoption is strongest where fit and placement uncertainty are highest: home decor, beauty, and jewelry. The way a merchant implements AR - whether through a 3D viewer, a try-on app, or a room visualizer - can point to both budget level and operating maturity.
For agencies, the most useful frame is simple: AR adoption signals design maturity, CRO sophistication, and paid media readiness. A merchant that has put money into mobile product visualization has already shown the budget, internal support, and commercial intent that make design retainers, CRO projects, and paid media engagements viable conversations [2].
StoreCensus can help you find these merchants by country, category, tech stack, and growth signals, then turn that into a targeted outreach list.
FAQs
How do I know if AR fits my product category?
Focus on fit-sensitive products. AR works best when shoppers need to judge size, scale, or physical dimensions before they buy. It helps close the gap between online browsing and what the product will look like in everyday life.
When you put AR in place, keep it simple and easy to use. Make the AR button easy to spot, use optimized 3D assets so scenes load fast, test the experience on mobile, and track engagement and conversion results.
What does AR adoption reveal about a Shopify merchant?
AR adoption usually points to a Shopify merchant that cares about advanced, mobile-first product visualization. The goal is simple: help shoppers judge products with more confidence before they buy.
It also hints at a strong focus on conversion rate optimization and lowering return friction. If customers can get a better sense of what they’re buying, they’re less likely to hesitate - and less likely to send the product back.
In many cases, these merchants are also more mature on the operations side. They’ve often put real effort into the mobile experience, which can signal that they’re a good fit for design-heavy, CRO-focused, or premium agency partnerships.
Which AR setup makes the most sense for my store?
For your Shopify store, the best AR setup depends on what you sell.
Start with products where fit and visual context matter most, like apparel or home goods. These are the items where AR can help shoppers feel more sure about what they’re buying. If someone can see how a chair looks in their living room or how a jacket might fit their style, that extra context can make a big difference.
On your product pages, make AR buttons easy to spot and simple to use. If the option is buried or hard to notice, most shoppers won’t use it.
For a better mobile experience, keep GLB and USDZ files under 5MB. Large files can slow things down, and that’s the last thing you want on a phone. It also helps to test across different mobile devices and keep an eye on performance so you can fine-tune your setup over time.