7 Engagement Metrics Every Shopify Agency Needs
Seven engagement metrics agencies should track to uncover conversion leaks, boost retention, and qualify high‑value Shopify leads.


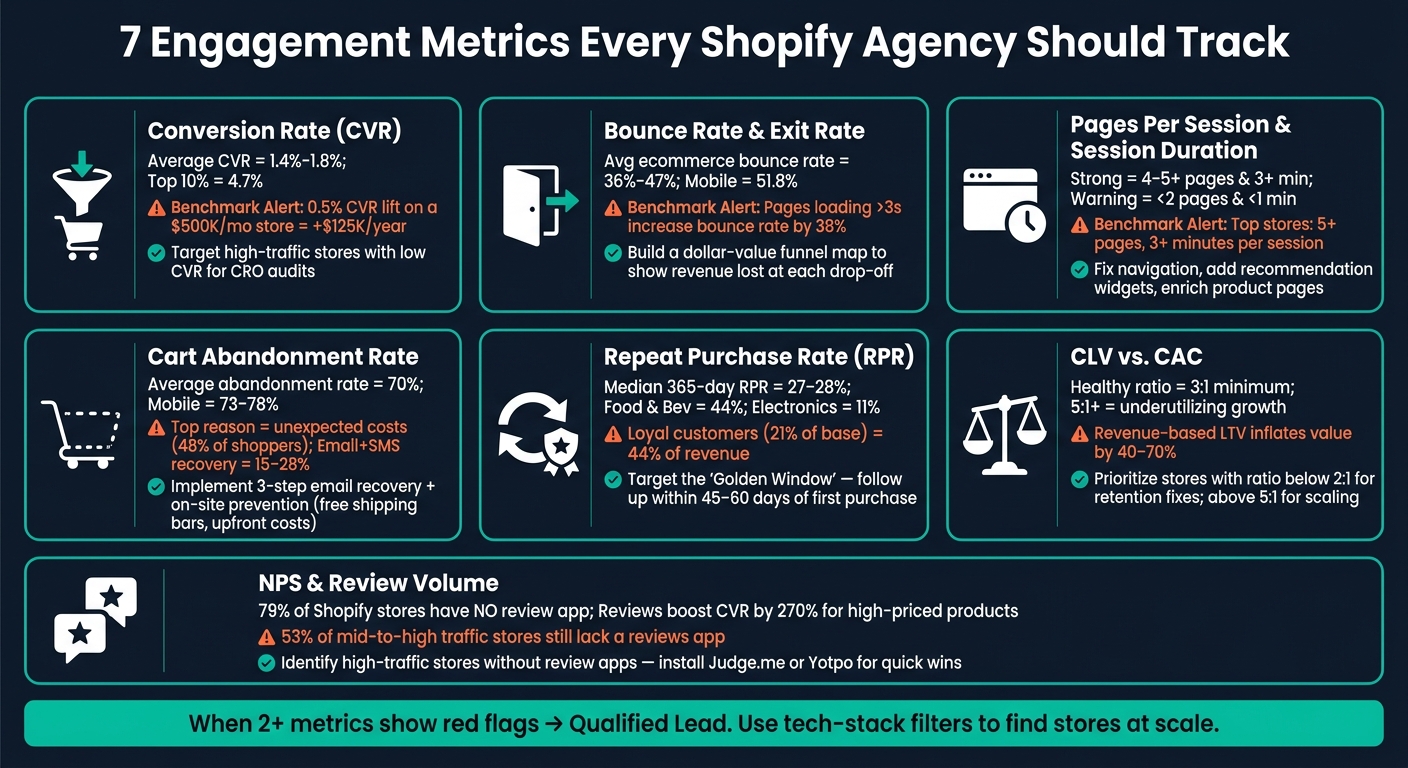
Most Shopify agencies focus on traffic and sales, but that’s not enough to measure real performance. Engagement metrics provide deeper insights into how visitors interact with a store, helping agencies pinpoint opportunities for growth and identify weaknesses. Here are the seven key metrics every Shopify agency should track:
- Conversion Rate (CVR): Tracks the percentage of visitors who complete a purchase. Low CVR often signals store issues, not traffic problems. Focus on high-traffic stores with poor CVR for quick wins.
- Bounce Rate and Exit Rate: High bounce rates suggest poor landing pages or irrelevant traffic, while high exit rates on checkout pages point to friction like hidden costs or account requirements.
- Pages Per Session & Session Duration: Low values here indicate poor navigation or unengaging content. Aim for 4+ pages per session and over 3 minutes of engagement time.
- Cart Abandonment Rate: With an average rate of 70%, this metric highlights lost sales opportunities. Address friction points like unexpected fees or limited payment options.
- Repeat Purchase Rate (RPR): Measures customer loyalty. A low RPR signals weak retention strategies. Focus on improving post-purchase flows and loyalty programs.
- Customer Lifetime Value (CLV) vs. Acquisition Cost (CAC): A healthy CLV:CAC ratio (3:1 or higher) shows sustainable growth. Poor ratios reveal inefficiencies in retention or ad spend.
- Net Promoter Score (NPS) & Review Volume: Reviews build trust and boost conversions, yet 79% of Shopify stores lack a review app. High-traffic stores without reviews are prime opportunities.
Key takeaway: These metrics help agencies identify stores with untapped potential. Tools like StoreCensus simplify the process by filtering Shopify stores based on traffic, apps, and other indicators, making lead qualification faster and more effective.
7 Engagement Metrics Every Shopify Agency Should Track
Shopify analytics- Top 5 Shopify Metrics You Must Track to Level Up Your eCommerce Store Performance

sbb-itb-61169e3
1. Conversion Rate
Conversion rate (CVR) represents the percentage of visitors who complete a desired action, like making a purchase. It’s a key metric for understanding how well a store turns interest into revenue. Even with 200,000 monthly visitors, a store with a low conversion rate - say, 0.9% - can still struggle to make money.
As the Braincuber Editorial Team puts it, "If you are sitting at 0.9% and celebrating high session numbers - stop. A low conversion rate is not a traffic problem. It is a store problem."
On average, Shopify stores achieve conversion rates between 1.4% and 1.8%, while the top 10% of stores hit around 4.7%. However, benchmarks vary by industry. For instance, Food & Beverage stores typically see conversion rates between 4.9% and 6.2%, whereas Luxury & Jewelry stores often only manage 0.5% to 1.0%. Comparing CVR within the same vertical is essential for an accurate evaluation.
For agencies, CVR is more than just a performance metric - it’s a tool for diagnosing issues and qualifying leads. For example, improving a store’s CVR by just 0.5% could add roughly $125,000 to annual revenue for a business generating $500,000 per month. This makes it easier to shift discussions from general improvements to recovering lost revenue. It also helps refine targeting strategies.
Instead of focusing solely on stores with low CVRs, prioritize high-traffic stores that struggle with conversion. Data shows that 40% of mid-tier Shopify stores (50K–200K monthly visitors) don’t use an email marketing app, and 67% lack a reviews app. Surprisingly, only 0.9% of Shopify stores use the full suite of Klaviyo, Gorgias, and Rebuy. Tools like StoreCensus can help identify these "high traffic, thin stack" stores, making it easier to find opportunities for improving conversions without manual research.
To dig deeper, analyze CVR by segments like device type, traffic source, or new versus returning visitors. This breakdown can uncover specific problem areas. For instance, mobile conversion rates typically range from 1.2% to 1.8%, while desktop rates are higher, averaging 1.9% to 3.2%. Such gaps often point to issues like checkout friction or slow-loading pages on mobile devices.
2. Bounce Rate and Exit Rate
Bounce rate reflects the percentage of visitors who land on a page and leave without interacting, while exit rate measures how many leave from a specific page, regardless of their prior activity. Think of bounce rate as an early-stage metric, while exit rate helps diagnose issues further along the user journey.
For agencies, understanding the difference between these metrics is key to identifying problems and opportunities. For example, a high bounce rate on a paid landing page often points to a disconnect between the ad and the page content or slow loading times. On the other hand, a high exit rate on a checkout page might signal obstacles like unexpected shipping costs or requiring account creation. The Build Grow Scale Revenue Optimization Team emphasizes:
"In 80% of cases, the biggest leak is not where the operator thinks it is. They are focused on checkout while their collection pages are bleeding 60% of potential PDP traffic."
Ecommerce benchmarks show an average bounce rate of 36% to 47%, with mobile rates significantly higher at 51.8% compared to 39.7% on desktop. Page speed plays a huge role: pages that take over 3 seconds to load can see bounce rates climb by 38%, and even a delay from 1 to 3 seconds increases bounce likelihood by 32%. Before jumping into a full UX overhaul, ensure the store's Largest Contentful Paint (LCP) is under 2.5 seconds, as slow infrastructure often mimics design flaws.
Here’s a quick reference for bounce and exit rate targets by page type:
| Page Type | Target Bounce Rate | Target Exit Rate |
|---|---|---|
| Product Pages | 30–45% | 20–40% |
| Collection Pages | 30–40% | - |
| Checkout Pages | Below 25% | 20–40% |
| Paid Landing Pages | 25–40% | - |
| Blog Posts | 65–90% | 70–80% |
One effective strategy is creating a "dollar-value funnel map" for a prospect’s store. This involves assigning revenue estimates to each drop-off point instead of focusing solely on percentages. For instance, instead of simply saying, "Your bounce rate is high", you could frame it as, "Your collection pages are costing you an estimated $X per month." This approach often accelerates client buy-in compared to a generic audit, making the data feel more actionable. By differentiating bounce and exit rates, agencies can unlock deeper insights into user behavior and engagement.
3. Pages Per Session and Average Session Duration
These two metrics help measure how engaged visitors are with your site. Pages per session tracks the number of pages a visitor views during a single visit, while average session duration (or "average engagement time" in GA4) shows how long they stay active. Together, they reveal whether your store is holding attention or causing visitors to leave quickly. Like conversion and bounce rates, these metrics can highlight areas that need improvement.
Here’s what to aim for: fewer than 2 pages per session and under 1 minute of engagement time are warning signs. Stores in good shape typically see 2–5 pages and 1–2 minutes per session. The top performers? They surpass 5 pages and 3 minutes. If both metrics are low, it could point to issues like confusing navigation, unappealing product pages, or content that doesn’t align with visitor expectations.
Take HorseWorldEU as an example. In February 2026, this equestrian supplies store revamped its site using Stylaquin's visual discovery features, swapping out standard product grids for a magazine-like layout. The results were impressive: visitors using the new layout averaged 10.0 product views per session and 5:24 of engagement time. That’s a substantial improvement compared to the 4.9 pages and 4:06 seen during standard browsing - an increase of 32% in engagement time. This boost also strengthened the store’s organic search signals.
"High traffic but low product views suggests poor navigation or irrelevant traffic. Low add-to-cart from product views indicates pricing, imagery, or copywriting issues." - Benly.ai
For agencies, these metrics provide clear clues about what’s going wrong. Low pages per session often signal broken navigation or weak internal linking. Fixes like breadcrumb trails, recommendation widgets, and links with strong context can encourage visitors to explore more. Similarly, short session durations typically mean product pages lack details - think sparse descriptions, too few images, or not enough social proof. To address this, enrich product pages with benefit-focused copy, lifestyle images, and customer reviews. It’s also smart to segment engagement data by traffic source. If organic visitors leave faster than paid ones, the store might be ranking for keywords that don’t match its products.
| Metric | Problematic | Average | Strong |
|---|---|---|---|
| Pages Per Session | < 2 pages | 2–3 pages | 4–5+ pages |
| Average Engagement Time | < 1 minute | 1–2 minutes | 3+ minutes |
4. Cart Abandonment Rate
Analyzing cart abandonment rates sheds light on where potential sales are slipping through the cracks.
In 2026, the average cart abandonment rate for ecommerce sits at around 70%. In simple terms, 7 out of every 10 shoppers who add items to their cart leave without completing a purchase. For agencies, this represents a clear sign of lost revenue.
It’s important to distinguish between cart abandonment (adding items but not starting checkout) and checkout abandonment (starting checkout but not finishing). These two behaviors highlight different problems that require tailored solutions. For instance, if shoppers abandon their cart before checkout, it might point to issues like unexpected costs or a lack of trust. On the other hand, drop-offs during checkout often stem from friction caused by forced account creation, clunky forms, or limited payment options.
Unexpected costs, such as surprise shipping fees, are the top reason for abandonment, cited by 48% of shoppers. Similarly, forcing account creation leads to 24–26% of abandonments. Solutions like enabling guest checkout and revealing shipping costs earlier in the process can help address these issues.
Mobile users are even more likely to abandon their carts, with rates between 73–78%, compared to 65–68% on desktop. This often comes down to poor mobile experiences, including slow load times or the absence of one-tap payment options like Apple Pay or Shop Pay. Interestingly, Shop Pay users see 10–15% lower abandonment rates compared to standard guest checkout, making it a smart choice for reducing friction.
To recover abandoned carts, a three-step email strategy works well: send a reminder after 1 hour, follow up with social proof at 24 hours, and provide an incentive at 72 hours. This approach can recover about 10–17% of abandoned carts. Adding SMS to the mix can boost recovery rates to 15–28%. However, 70% of abandoners never provide an email address, making them unreachable for recovery campaigns. That’s why focusing on on-site prevention - like free shipping progress bars, upfront cost transparency, and exit-intent overlays - often delivers better results than recovery efforts alone.
"If the root problem is checkout friction, your reminder sequence just sends people back into the same broken experience." - Dan Stevens, App Developer, LAUNCHTIP
Cart abandonment often highlights a lack of investment in key tools. For example, 28.5% of mid-traffic Shopify stores (50K–200K monthly visitors) don’t use any email marketing app. This means they’re missing out on basic recovery strategies. Tools like StoreCensus can help identify high-traffic stores without email recovery systems, offering a straightforward way to find and analyze Shopify stores that need help optimizing their conversions.
5. Repeat Purchase Rate and Purchase Frequency
Retention metrics go beyond initial engagement, offering insights into long-term customer loyalty. Two key indicators of loyalty are Repeat Purchase Rate (RPR) and Purchase Frequency, which measure how often customers return to buy again over a specific time frame. These metrics help determine whether a store is cultivating genuine loyalty or relying heavily on one-time buyers.
Customer retention is a major driver of profitability. Returning customers typically spend about 67% more than new ones and cost 5 to 25 times less to acquire. Interestingly, while loyal customers may only make up 21% of a store's customer base, they often account for 44% of revenue and 46% of all orders. For Shopify stores, the median 365-day RPR hovers around 27–28%, though this varies significantly depending on the industry. For example, Food & Beverage brands see an average RPR of 44%, while Electronics stores average just 11%.
| Industry | 365-Day RPR | Median Days to Order 2 |
|---|---|---|
| Food & Beverage | 44% | 28 days |
| Supplements & Wellness | 42% | 32 days |
| Beauty & Personal Care | 38% | 42 days |
| Apparel & Fashion | 24% | 68 days |
| Home Goods & Decor | 18% | 94 days |
| Electronics | 11% | 142 days |
(Source:)
For agencies, one of the most actionable insights lies in the "Golden Window" - the critical time frame between a customer's first and second purchase. If a customer doesn’t make a second purchase within 45–60 days, the chances of them returning drop by 60–70%. Stores where the median time to a second order exceeds 1.5× the industry average often reveal issues with post-purchase follow-up, signaling an opportunity to improve email or SMS campaigns.
"If your median first-to-second window is more than 1.5x the industry median, your post-purchase flow is firing too late." - Dror Aharon, CEO, COREPPC
Delayed follow-ups can lead to steep declines in repeat purchases, forcing stores to rely on discounts to drive sales. While a high RPR might seem promising, if 50% or more of repeat orders are driven by discounts, it suggests price dependency rather than true loyalty. Switching from blanket discounts to tiered VIP rewards programs can help preserve profit margins while still encouraging repeat purchases.
Tools like StoreCensus make it easier for agencies to identify stores that lack loyalty programs or email marketing apps, highlighting untapped opportunities to boost repeat revenue.
"Most brands I audit have 90-day repeat purchase rates under 18%. With even modest system improvements... we routinely get that to 34% or higher within two quarters." - Nik Sharma, Founder, Sharma Brands
6. Customer Lifetime Value vs. Acquisition Cost
When it comes to long-term profitability, the CLV:CAC ratio is a key metric for Shopify stores. It shows whether a brand is building sustainable profit or burning cash on short-term revenue goals. For agencies, this ratio acts as a litmus test, helping identify if a merchant is ready to scale up or if they need to address fundamental cost and profit issues first.
The widely accepted benchmark for a healthy CLV:CAC ratio is 3:1. This means for every $1 spent on acquiring a customer, the business should earn at least $3 in profit. However, this benchmark is only accurate when calculated using profit-based LTV. Relying on revenue-based LTV can inflate customer value by 40% to 70%, which can lead to poor scaling decisions.
"A merchant with $40 CAC and $50 AOV looks broken on the first order. Same merchant with $280 CLV over 18 months is printing money. CAC alone is a snapshot. CLV is the whole movie." - Umid, Co-Founder, Craftshift
While the CLV:CAC ratio is essential, it must be paired with a reasonable CAC payback period to provide a full picture of financial health. Even a 4:1 ratio can be problematic if the CAC payback period stretches beyond 12 months. For example, Allbirds faced challenges with extended payback periods, which hurt their margins and led to store closures. Ideally, DTC brands aim for a CAC payback period under 6 months if bootstrapped or under 12 months if venture-backed.
For agencies, the CLV:CAC ratio is a powerful tool for evaluating whether a store is ready to scale. Stores with ratios above 5:1 often signal under-investment in growth and may represent untapped scaling opportunities. On the other hand, stores with ratios below 2:1 likely need to focus on improving customer retention and profit margins before scaling further. Tools like StoreCensus can help agencies find and target Shopify stores with strong scaling potential, such as those with high traffic and streamlined operations, while also highlighting areas for improvement.
| LTV:CAC Ratio | What It Signals | Recommended Agency Action |
|---|---|---|
| Below 1:1 | Losing money on every customer | Halt scaling efforts; fix unit economics first |
| 1:1 to 2:1 | Barely sustainable | Prioritize retention and conversion rate improvements |
| 3:1 | Minimum threshold for healthy growth | Confidently scale proven marketing channels |
| 5:1 or higher | Growth potential being underutilized | Invest aggressively to capture more market share |
7. Net Promoter Score and Review Volume
Net Promoter Score (NPS) might be private, but review volume and the presence of review apps can act as practical indicators of customer satisfaction. For Shopify stores, reviews do more than just build trust - they can significantly impact sales. For instance, showcasing reviews can boost conversion rates by 270% for higher-priced products. Despite this, a staggering 79% of Shopify stores don’t have a review app installed.
This lack of review infrastructure presents a clear opportunity. Stores attracting over 50,000 monthly visitors but failing to collect or display customer feedback are essentially leaving money on the table. In fact, 53% of mid-to-high traffic stores still don’t use a reviews app. Without social proof, these stores miss out on a proven way to convert visitors into buyers.
"30k visitors but no social proof? That's a conversion leak." - StoreInspect Team
Adoption rates for review apps differ across industries. For example:
- Beauty: 42.3%
- Fashion: 25.1%
- Hobby: 17.6%
- Automotive: 18%
These numbers reveal untapped potential for targeted outreach. Agencies can step in by identifying stores without review systems and offering solutions to improve their conversions.
When qualifying leads, focus on stores with high traffic, a Klaviyo integration, and no review app. These businesses are prime candidates for quick wins. For example, installing a review app like Judge.me (currently the most popular with 12.4% adoption) is a straightforward way to deliver immediate returns. Tools like StoreCensus can help you pinpoint stores in the 50K–200K traffic range that lack review apps. This simple filter can uncover a goldmine of potential clients with a specific, solvable issue. Use these insights to fine-tune your outreach and engagement strategies.
Comparison Table
These seven metrics provide insights into store performance, identifying potential revenue leaks and opportunities for targeted agency interventions. The table below outlines each metric, what it signals about store health, and the corresponding action agencies can take.
| Metric | What It Measures | Store Health Indicator | Agency Action |
|---|---|---|---|
| Conversion Rate | Percentage of visitors who complete a purchase | Low rates point to issues with user experience, pricing, or trust | Suggest CRO audits, A/B testing, or custom themes |
| Bounce / Engagement Rate | Percentage of sessions that meet engagement criteria (e.g., >10 seconds, 2+ pages, or conversions) | Rates below 50% suggest irrelevant traffic or weak landing pages | Improve landing pages or adjust SEO content strategy |
| Pages Per Session & Duration | Average pages viewed and time spent per visit | 4+ pages viewed and 3+ minutes spent indicate strong interest in the catalog | Enhance site search and implement cross-sell strategies |
| Cart Abandonment Rate | Percentage of users who add items to the cart but don’t complete checkout | High rates indicate significant checkout friction | Propose email/SMS recovery flows; note that 94% of stores lack upsell tools |
| Repeat Purchase Rate | Percentage of customers with repeat purchases | Low rates in consumable niches highlight a lack of retention strategies | Recommend loyalty programs or subscription models; a 5% increase in retention can boost profits by 25–95% |
| CLV vs. CAC | Customer lifetime value compared to acquisition cost | Poor ratios reveal inefficient ad spend or unscaled growth | Focus on stores with average order values over $75 for better unit economics |
| NPS & Review Volume | Customer willingness to recommend and total feedback volume | With 66% of stores missing a reviews app, they lose out on social proof and SEO benefits | Suggest setting up a review platform like Judge.me or Yotpo |
Cross-referencing these metrics can uncover significant opportunities. For instance, a store using Klaviyo and Meta Ads but struggling with a 70% cart abandonment rate and no reviews app represents a clear gap that agencies can address.
"Instead of convincing stores to switch from a competitor, find stores that don't have the thing at all. That's a much easier conversation." - StoreInspect Team
Use this table as a practical tool during prospecting. When a store shows two or more red flags across these metrics, it signals a strong lead. Tools like StoreCensus allow you to filter over 2.5 million Shopify stores by traffic, installed apps, and tech stack - making it easier to identify these gaps at scale.
Conclusion
These metrics create a framework for qualifying leads. Together, they help determine if a store has the potential to invest in your services, highlight areas for improvement, and identify signals that make your outreach feel precisely tailored.
The real value comes from identifying mismatches. Imagine a store with 30,000 monthly visitors but using a free theme and no email automation. That store isn't struggling - it’s simply underinvested. Approaching such a lead is far easier than trying to replace an established agency. When multiple metrics point to issues, you’re dealing with a qualified lead, not just a random prospect.
However, this manual process has its limits. Researching 10–20 stores per hour means you’ll spend more time digging for information than actually reaching out. Tools like StoreCensus simplify this by filtering over 2.5 million Shopify stores based on traffic, installed apps, themes, and revenue indicators. It also provides verified decision-maker contacts - founders, CMOs, and Ecommerce Managers - so you’re not stuck emailing generic "info@" addresses.
"The goal isn't more leads. It's better leads. 50 qualified stores will outperform 500 random ones every time." - StoreInspect Team
FAQs
Which engagement metrics matter most for qualifying Shopify agency leads?
Focus on engagement metrics that reveal intent and readiness to act. Metrics like engaged sessions and average engagement time help identify quality traffic, while the conversion rate measures how effectively your efforts are driving results. Keep an eye on on-site actions such as visits to the pricing page or demo requests, as these often signal high interest.
To gauge fit and urgency, monitor store activity - look for signs like recent app updates or shifts in strategy. Additionally, check how accessible decision-makers are, as this can impact your ability to move forward quickly.
For a starting point, aim for stores with 10,000–50,000 in traffic, Plus or paid themes, a strong app stack, and active ad campaigns. These characteristics often indicate a business with both capacity and intent to engage further.
How can I tell if a low conversion rate is due to my store or traffic?
Take a close look at your Shopify Analytics and break down performance by traffic source. If you notice that certain channels - like paid social - are showing much lower conversion rates compared to organic search or direct traffic, the problem might be low-quality traffic.
Here are some red flags to watch for:
- A bounce rate higher than 65%
- Session durations under 30 seconds
- Add-to-cart rates falling below 2%
On the other hand, if all your traffic sources are underperforming and your site metrics reveal friction points - like slow load times or clunky navigation - it’s probably an issue with your store itself.
What’s the fastest way to find high-traffic Shopify stores missing key apps like reviews or email?
The fastest way to pinpoint high-traffic Shopify stores lacking essential apps is by using StoreCensus. This tool allows you to sift through a massive database of over 2.5 million stores, filtering them based on traffic, revenue, and tech stack.
Here’s how it works: Apply filters to focus on stores with substantial monthly traffic (like 50,000+ visitors) and exclude specific apps, such as those for reviews or email marketing. On top of that, StoreCensus provides verified contact details for decision-makers, making it easier to reach out to stores with clear gaps in their infrastructure.