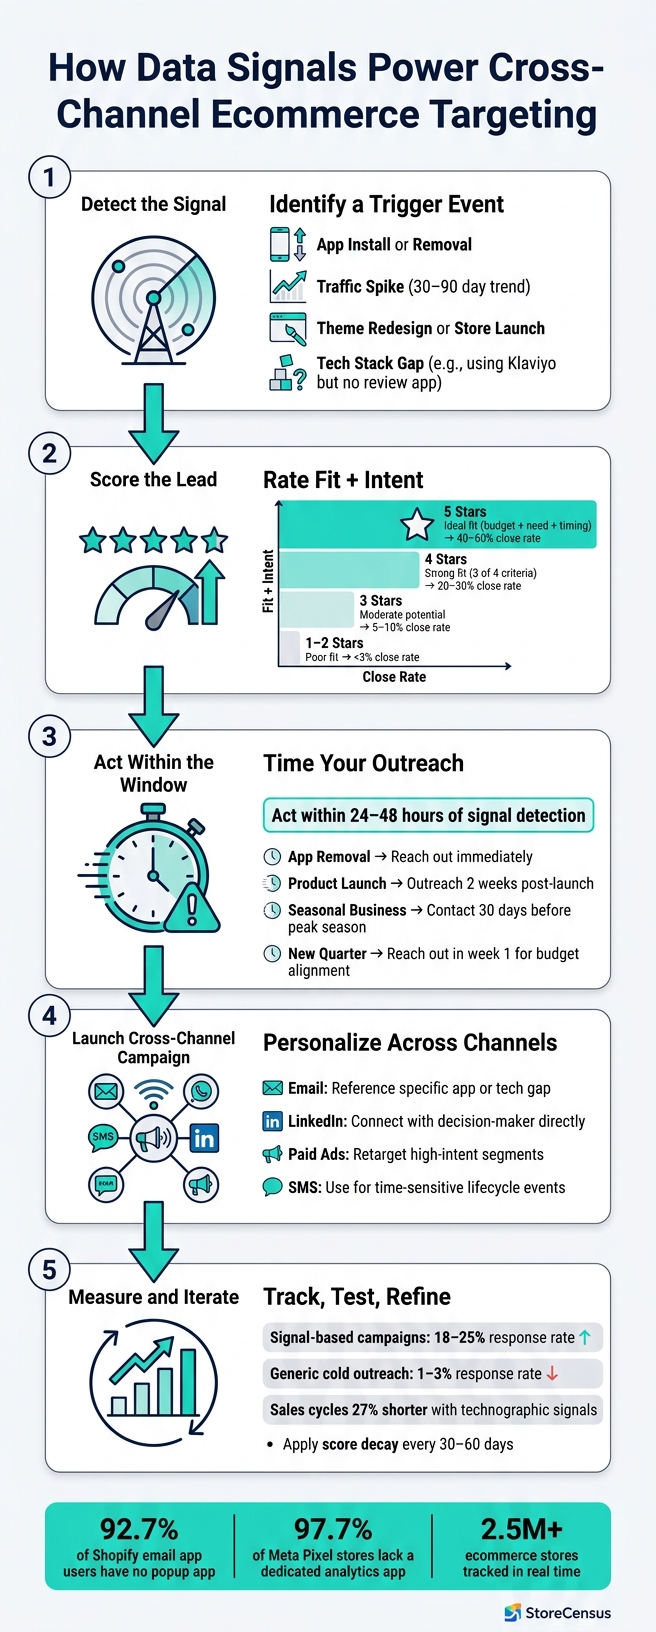
How Data Signals Improve Cross-Channel Targeting
Use app, growth, and lifecycle signals to time cross-channel outreach and boost engagement and conversions.


Most ecommerce campaigns fail because they target the wrong audience at the wrong time. Data signals solve this by identifying when a store is ready to act using Shopify store guides - whether it’s making a purchase, switching tools, or scaling up. These signals, like app installations, traffic trends, or tech stack changes, help you understand a store’s behavior and intent.
Here’s why this matters: Reaching prospects through multiple channels - email, SMS, social media, and direct outreach - boosts engagement and ensures your message lands at the right time. For example, 92.7% of Shopify stores using email marketing apps don’t have a popup app, which is a missed opportunity to capture leads. Tools like StoreCensus track over 2.5 million ecommerce stores, providing real-time insights so you can act fast and effectively.
Key Takeaways:
- Data Signals: Track app installs, tech changes, traffic growth, and lifecycle events to identify high-intent prospects.
- Cross-Channel Targeting: Combine outreach methods for consistent messaging and better results.
- Timing Matters: Acting within 24–48 hours of a signal increases your chances of success.
- StoreCensus: A tool to surface real-time data signals, helping you build targeted campaigns.
The result? Smarter campaigns, better timing, and higher response rates.
Data Signals Help to Refine Cross-Platform Ad Targeting: Spark Foundry’s Lisa Giacosa

sbb-itb-61169e3
Core Types of Ecommerce Data Signals
Data signals provide insights into a store's tools, growth trajectory, and the best times to engage. Knowing how to interpret these signals can mean the difference between a campaign that resonates and one that misses the mark.
Technology and App Stack Signals
A store’s app stack offers clues about its priorities. For instance, a Shopify store using Klaviyo is focused on email marketing, while one with ReCharge is likely building a subscription-based model. On the other hand, stores lacking these tools might represent untapped opportunities.
App removals can also be telling. If a store recently uninstalled a competitor’s review app, it’s likely searching for a better option. Similarly, upgrading from a free theme to a paid, performance-focused one often signals a strategic pivot, such as preparing for a new product launch or aiming to boost conversions. These moments open a narrow window where well-timed outreach can make a big impact.
Platforms like StoreCensus organize these signals into actionable data. For example, you can filter for segments like "Shopify stores using subscription apps but no email platform" or "stores that switched themes in the past 30 days." This level of precision allows for tailored campaigns that resonate far better than generic outreach.
Growth and Performance Signals
While technology signals show what tools a store uses, growth signals reveal where the store is headed - and whether it’s worth pursuing right now.
Key growth indicators include traffic trends over 30, 60, or 90 days, estimated revenue ranges, and changes to product catalogs. For example, a store that recently added 100+ SKUs is likely expanding its offerings, while one with a 30–50% traffic increase over the last quarter probably has the resources and ambition to scale further. These metrics help you focus on stores with real momentum.
Revenue estimates, inferred from traffic, order proxies, and catalog size, are particularly useful. A store making $1M–$5M annually will have different needs and budgets than one just breaking into the $250K range. Understanding these differences allows you to fine-tune your approach.
Growth signals show potential, but lifecycle events can pinpoint the exact moment to act.
Activity and Lifecycle Signals
Unlike ongoing growth or tech signals, activity and lifecycle signals are specific moments in time - and they often present the best opportunities for outreach.
Events like store launches, theme redesigns, or reactivations signal that a merchant is actively exploring new tools or strategies. Reaching out within days of such an event, rather than weeks later, can make your message more relevant and welcome.
Tools like StoreCensus offer real-time alerts for these critical moments, enabling timely, cross-channel outreach that aligns with what the merchant needs most.
| Signal Category | What It Reveals | Best Used For |
|---|---|---|
| Technology & App Stack | Maturity, tool gaps, vendor choices | Targeting integration opportunities or upgrades |
| Growth & Performance | Scaling momentum, budget capacity | Prioritizing high-value prospects |
| Activity & Lifecycle | Transition moments, active projects | Timing outreach for maximum relevance |
How to Apply Data Signals Across Channels
How Data Signals Power Cross-Channel Ecommerce Targeting
Spotting data signals is just the first step. The real game-changer is using those signals to connect with the right merchants at the perfect moment.
Using App Install Signals to Build Targeted Campaigns
When a store installs a new app, it’s like a spotlight on their current priorities. For instance, adding a loyalty app suggests they’re focusing on customer retention, while installing an upsell tool points to efforts to boost average order value. These behavioral clues are gold for crafting targeted campaigns. With StoreCensus, you can filter and reach out to stores based on their recent app installations.
Here’s an example: If you provide email marketing services, you could target stores using Klaviyo but lacking a review platform. This opens up a natural conversation starter: “I see you’re using Klaviyo but haven’t connected a review tool yet. Did you know most brands see X% improvement in customer feedback by linking the two?”
App removals are just as telling. If a store uninstalls a competitor’s tool within the last 48 hours, they’re likely hunting for a replacement. Reaching out during this window - via email, LinkedIn, or ads - gets you in front of a decision-maker at the right time.
| Trigger Scenario | Recommended Timeline | Outreach Approach |
|---|---|---|
| App Install Gap | Immediately | "Noticed you're using [App A] but not [App B]. Most brands see [X%] gain by connecting them." |
| App Removal | Within 24–48 hours | Suggest a better alternative or offer a technical audit of their current stack. |
| Competitor Uninstall | Immediately | "I noticed you recently moved away from [Competitor]. We offer [Specific Benefit] that addresses [Common Pain Point]." |
Every app signal - whether it’s an install or removal - should guide a personalized outreach strategy. From here, let’s dive into growth signals to zero in on high-intent prospects.
Using Growth Signals to Focus on High-Intent Segments
Growth signals provide another layer of insight, highlighting stores that are gaining momentum and are likely ready to invest in new tools. For example, a store experiencing steady traffic growth and expanding its product catalog signals readiness to take the next step. These high-intent stores are ideal for focused ad spend and outreach, driving better results.
Here’s the kicker: campaigns based on these signals often see response rates of 18–25%, compared to the 1–3% you’d get with generic cold outreach. With StoreCensus, you can create segments based on revenue tiers, traffic trends, and catalog growth. This allows your team to target stores hitting key milestones, like moving from $250K to over $1M in revenue, without wasting time manually sorting through leads.
Timing Outreach Around Lifecycle Signals
Lifecycle events - like store launches, redesigns, or reactivations - are prime opportunities to connect with merchants. These moments often mark when they’re most open to adopting new tools. By leveraging real-time data from StoreCensus, you can time your outreach to align perfectly with these events.
| Trigger Scenario | Recommended Timeline | Outreach Approach |
|---|---|---|
| Product Launch | 2 weeks after launch | "Congrats on launch! Ready to tackle [specific scaling problem]?" |
| Traffic Spike | Immediately upon detection | "Noticed your recent growth! We help stores at your scale optimize [X]." |
| Seasonal Business | 30 days before season | "Busy season coming. Let’s get a solution in place now." |
| Budget Timing | 1st week of new quarter | "Budget should be refreshed now. Still interested in [solution]?" |
Measuring and Improving Signal-Driven Campaigns
Once your signal-driven campaigns are live, the next step is figuring out how well they’re working - and where you can make adjustments to improve outcomes.
Key Metrics to Track Campaign Performance
To gauge success, focus on metrics like click-through rate (CTR), conversion rate, Customer Acquisition Cost (CAC), and Return on Ad Spend (ROAS). These numbers reveal how well your targeting is hitting the mark. For context, the average ecommerce conversion rate usually falls between 2% and 3% - a good signal-driven campaign should surpass this benchmark if your audience segments are well-defined.
Beyond these standard metrics, consider tracking Customer Lifetime Value (CLV) alongside CAC. A low CAC isn’t enough if the customers you’re acquiring don’t provide lasting value. Also, shift from last-click attribution to multi-touch attribution for a fuller picture of how different signals and touchpoints contribute to conversions.
Accurate measurement lets you fine-tune your cross-channel strategies to align with real-time market signals.
Testing Signal-Based vs. Static Targeting
One of the quickest ways to validate the effectiveness of signal-driven targeting is through a controlled test. Divide your outreach into two groups: one dynamic, signal-based segment (e.g., stores that installed a shipping app within the past seven days) and one static list (based on factors like industry or store size). Use identical messaging for both groups over a 30-day period, then compare results like open rates, CTR, MQL-to-SQL conversions, and lead score velocity - how quickly leads move from initial contact to a sales conversation.
Signal-based segments often outperform static lists because they engage prospects when they’re actively showing intent. These insights can guide you in refining your targeting strategies.
Adjusting Segments Based on Campaign Results
Use the data from your tests to refine your audience segments. Look for signals that consistently lead to conversions and identify those that don’t. For example, if stores installing a review app convert three times more often than those only showing traffic growth, it’s clear where to focus your efforts.
A helpful framework is to rate your leads based on fit and intent, then allocate your team’s time accordingly:
| Lead Rating | Criteria | Time Investment | Expected Close Rate |
|---|---|---|---|
| 5 Stars | Ideal fit: budget + need + timing | 60% of time | 40–60% |
| 4 Stars | Strong fit: 3 of 4 criteria met | 25% of time | 20–30% |
| 3 Stars | Moderate potential: needs nurturing | 10% of time | 5–10% |
| 1–2 Stars | Poor fit: archive or long-term | 5% or less | <3% |
To keep your segments relevant, apply score decay, which reduces the value of older signals over time. A store that installed a new app six months ago isn’t as promising as one that did so last week. Update your thresholds every 30–60 days to ensure your targeting stays sharp and aligned with current intent.
A Step-by-Step Plan for Getting Started
Ready to refine your targeting strategy? Follow this plan to make the most of your data signals and improve your approach.
Audit Your Current Targeting and Data Sources
Start by taking a close look at your current lead lists to spot any weaknesses. Evaluate factors like fit, budget indicators, pain points, reachability, and timing. For example, an average raw fit score of 72.8 out of 100 might show areas where your data could be improved.
Use these five layers to guide your evaluation:
- Fit: Does the lead align with your category and geography?
- Budget Evidence: Are they investing in Shopify Plus or paid apps?
- Pain Signals: Are they missing tools or apps that you can provide?
- Reachability: Do you have a verified contact for a decision-maker?
- Timing: Have there been recent store changes that make now the right moment to reach out?
Keep timing in mind - it’s crucial your data reflects recent activity, ensuring your outreach is well-timed.
| Scoring Layer | What to Measure | Why It Matters |
|---|---|---|
| Fit | Category, geography | Confirms the store matches your offer |
| Budget Evidence | Shopify Plus status, paid theme, app depth | Indicates investment in growth |
| Pain Signals | Missing app category, outdated theme | Provides a reason to reach out |
| Reachability | Verified email, decision-maker role | Ensures the account is usable |
| Timing | Recent app changes, seasonal context | Highlights who to contact now |
Make sure your contact data is SMTP-verified - unverified emails can lead to high bounce rates and wasted time. Another tip? Filter by traffic tier. Stores with over 50,000 monthly visitors tend to score higher on lead fit (average 96.9) compared to stores with fewer visitors (60.2).
Once you’ve identified data gaps, you can move on to enhancing your data with tools like StoreCensus.
Set Up StoreCensus to Collect and Organize Signals
StoreCensus is a powerful tool for enriching your data with real-time ecommerce insights. Use it to create filtered segments based on criteria like installed apps, Shopify Plus status, traffic levels, category, and geography. You can even configure real-time alerts for specific signals - like when a merchant installs a shipping app (if you offer fulfillment services) or removes a competitor’s app (if you provide a conversion optimization tool). This way, you can approach merchants at the perfect time, when they’re actively considering solutions.
Launch Signal-Driven Campaigns and Iterate
With your enriched data ready, it’s time to put it to work. Start small by testing one high-confidence signal, such as a recent app installation, and tailor your campaign around it. Keep the audience focused, the messaging clear, and run the campaign for two to three weeks to gather actionable data.
As results roll in, use the scoring framework from earlier to identify which signals are driving conversions. Once you’ve validated what works, gradually expand to include additional signals and channels. The key is to continuously refine your targeting based on real-world performance, not assumptions. This iterative approach ensures your campaigns stay effective and aligned with your goals.
Conclusion: Better Targeting Starts with Better Data
Cross-channel targeting thrives on real-time data, not outdated lead lists. While static lists might show who a store used to be, current data signals reveal who they are right now and, more importantly, what actions they’re taking today.
Signals like app installs, gaps in their tech stack, and key traffic milestones can uncover true buying intent - often before a prospect even reaches out. For instance, companies leveraging technographic signals have reported sales cycles that are 27% shorter, giving them a competitive edge. Plus, consider this: about 97.7% of stores running Meta Pixel ads don’t have a dedicated analytics app. That means many are spending on ads without a reliable way to measure their return on ad spend (ROAS).
Timing matters just as much as precision. Acting on a signal within 24–48 hours - or even faster - can significantly boost your chances of securing a meeting. For example, a merchant who recently uninstalled a competitor’s app or hit a traffic milestone is likely in an active decision-making phase, but that window closes quickly.
The most effective strategies combine multiple signals. When stores show three or more indicators - like high traffic, missing essential apps, and recent tech stack changes - it creates a compelling case for outreach. This approach not only sharpens your pipeline but also minimizes wasted efforts. Ultimately, timely, multi-signal insights turn outreach into measurable wins.
FAQs
Which data signals matter most for my offer?
Key data signals such as app installs, growth trends, tech stack changes, revenue milestones, and behavioral patterns play a crucial role in shaping your approach. These insights can fine-tune lead scoring, allow for real-time targeting, and boost response rates by ensuring your outreach aligns with the most promising, high-intent opportunities.
How do I turn a signal into a cross-channel campaign?
To transform a data signal into a cross-channel campaign, leverage real-time signals such as app installs, growth trends, or tech-stack updates. These signals can guide your outreach strategy and messaging by triggering automated workflows, prioritizing leads with higher potential, and tailoring communication to reflect buyer intent. Keep a close eye on these signals to launch targeted campaigns across platforms like email, social media, and ads. This approach ensures your messaging stays timely and relevant, driving better engagement and higher conversion rates.
How can I score and prioritize signal-based leads?
To identify and prioritize high-intent leads, leverage real-time data signals like app installs, growth patterns, and changes in tech stacks. Pay close attention to indicators such as app removals, revenue milestones, and activity trends - these can reveal which leads are actively growing or undergoing significant changes. Assign scores to these leads based on their activity and automate workflows to engage them at the perfect moment, increasing your chances of conversion.