Customer Demographics for Lead Scoring in Shopify
Score and prioritize Shopify leads using demographics—traffic, Shopify plan, tech stack, and verified decision-maker contacts.

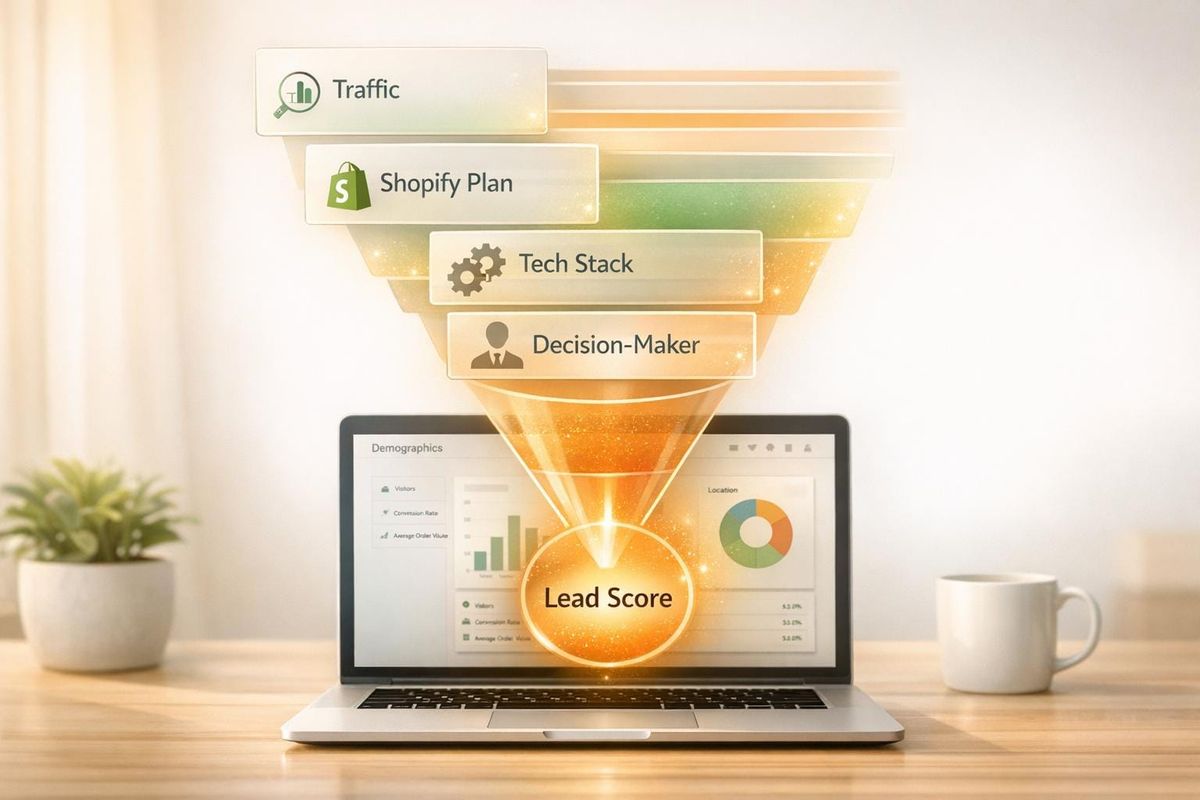
When targeting Shopify merchants, most agencies waste time on low-quality leads. The solution? Lead scoring with demographics. By focusing on factors like traffic, Shopify plan, and tech stack, you can identify high-value prospects and avoid dead ends.
Key takeaways:
- Traffic matters: Stores with 50K+ monthly visitors score higher (96.9 vs. 60.2 for smaller stores).
- Shopify Plus is a signal: Only 15.4% of stores use it, but these merchants often have larger budgets.
- Decision-makers are critical: Verified contacts (e.g., founders) double your chances of outreach success.
Pro tip: Combine demographic scoring with behavioral data (like demo requests) to prioritize leads ready to buy. Tools like StoreCensus can streamline this process by filtering over 6 million Shopify stores based on your Ideal Customer Profile (ICP).
Let’s break down how to build and refine a scoring model that works.
How to Find Shopify Store Leads With Contact Information Fast | StoreCensus Shopify Tool

sbb-itb-61169e3
Defining Your ICP Using Demographic Data
Before you start scoring leads, it's crucial to define your target. Your Ideal Customer Profile (ICP) represents a specific set of attributes that indicate a merchant's potential, needs, and accessibility.
Key Demographic Attributes for Shopify Merchants
When crafting an ICP for Shopify merchants, six key attributes stand out:
| Attribute | Why It Matters for Lead Scoring |
|---|---|
| Store Location | Helps determine if the merchant aligns with your geographic focus (e.g., US-only agencies). |
| Traffic Tier | Serves as a primary indicator of business size and budget readiness. |
| Shopify Plan | Plus status highlights enterprise-level needs and spending capacity. |
| App/Pixel Depth | Reflects investment behavior and technical sophistication. |
| Product Category | Identifies niche fit and relevant challenges. |
| Decision-Maker Role | Shapes your approach to messaging and outreach. |
Traffic tier is particularly important. For example, 84.5% of Shopify stores get fewer than 50,000 monthly visitors, and merchants in this group tend to install just 1.5 apps on average. These smaller stores often represent low-value opportunities for agencies. In contrast, stores with over 50,000 monthly visitors are usually scaling and more likely to seek external support.
The Shopify plan is another clear indicator. While only 15.4% of active Shopify stores use Shopify Plus, this group accounts for a significant portion of high-budget opportunities. Plus adoption grows with store size - from 6.6% for stores under 50,000 visitors to 100% for stores exceeding 1 million visitors.
These attributes help distinguish between company-level and contact-level data, both of which are critical for effective targeting.
Company-Level vs. Contact-Level Data
When thinking about ICP data, it's helpful to break it into two layers. Company-level data (or firmographic data) answers whether an account is worth pursuing. This includes revenue tier, traffic volume, Shopify plan, app depth, and product category. Contact-level data, on the other hand, focuses on whether you can actually reach the right person - things like job titles, seniority, and the availability of a verified personal email.
Both types of data are important but serve different purposes. A store might look ideal based on company-level data but still be unreachable. For example, only 12.2% of Shopify stores have a verified, non-generic email address. This makes it harder to connect with a specific decision-maker.
"Founder and Owner are the two most common titles among identifiable contacts... Most Shopify stores are founder-run businesses." - StoreInspect Team
This insight is crucial for your outreach strategy. If your ICP leans toward smaller direct-to-consumer (DTC) brands, you're likely pitching to a founder rather than a CMO. Tailoring your messaging to a founder's perspective will resonate much better than a corporate-style sales pitch.
Once you've defined your ICP at both the company and contact levels, the next step is to validate your profile with real-world data.
How to Validate Your ICP with Data
Defining your ICP is just the first step. The real test is confirming that your target audience exists in sufficient numbers. A practical way to validate your ICP is by filtering Shopify stores based on your criteria - like category, location, traffic tier, and tech stack - and calculating how many stores fit the profile. If your ICP yields fewer than a few hundred matches, it might be too narrow to support consistent outreach.
Tools like StoreCensus are invaluable for this process. With access to over 6 million Shopify stores, you can filter by revenue signals, tech stack, theme, country, and growth indicators before sending any outreach. This ensures you avoid the common mistake of building a scoring model around an ICP that doesn’t exist at scale. For instance, if you're targeting US-based fashion stores on Shopify Plus with 50,000+ monthly visitors and active advertising, you can verify the pool size before committing resources.
Here's a useful benchmark: fashion is Shopify's largest vertical, accounting for 23.1% of all stores, and 58.9% of Shopify stores are US-based. If your ICP focuses on US fashion merchants, you'll have a large base to work with. Narrowing it further by adding criteria like Shopify Plus status and active ad spend will reduce the pool but leave you with higher-quality leads.
A well-defined and validated ICP is the foundation for selecting the right demographic fields and creating an effective scoring model.
Choosing Demographic Fields for Lead Scoring
Once you've nailed down your Ideal Customer Profile (ICP), the next step is to convert it into actionable demographic fields within your CRM or outbound tool. The key here is prioritization - not all data points are equally important. Some fields strongly predict fit and budget, while others simply add context.
High-Impact Demographic Fields for Shopify Agencies
When it comes to Shopify agencies, demographic fields generally fall into three categories: size signals, budget indicators, and reachability.
- Size signals: The most reliable metric here is traffic tier. As mentioned earlier, this remains the top indicator of store size and potential.
- Budget indicators: Focus on Shopify Plus status, theme type (custom/paid vs. free), and app depth. For example, Shopify Plus merchants typically use 3.9 apps and 7.9 tracking pixels, compared to 1.4 apps and 3.8 pixels for standard stores. A store running a custom theme with six or more apps and active tracking pixels signals a serious investment in growth.
- Tech maturity: Stores categorized as "Advanced" (six or more apps and multiple tracking pixels) average a lead score of 98, while "Basic" stores (one to two apps) score around 53. Agencies offering services like retention, CRO, or paid media should focus on Advanced or Intermediate stores for better results.
These categories help you separate critical data points from those that are merely helpful.
Must-Have vs. Nice-to-Have Demographic Fields
Not every field carries the same weight in your lead scoring process. Some are non-negotiable for qualifying leads, while others enhance your scoring model without being dealbreakers. And don’t forget - certain fields can actively lower a lead’s score if they indicate a poor fit.
| Field Type | Examples | How to Use It |
|---|---|---|
| Must-Have | Traffic tier (50K+ floor), category match, country, contact availability | Disqualify leads that don’t meet these thresholds. |
| Nice-to-Have | Specific app gaps, Meta ad markers, Instagram follower count | Add scoring weight to improve personalization and prioritization. |
| Disqualifier | No reachable contact, wrong platform, irrelevant category | Apply a negative score (e.g., -15 to -20 points) for poor fit indicators. |
For example, if a lead lacks a reachable contact, it doesn’t matter how well they fit in other areas. Applying a penalty of -15 points for missing contacts or -20 points for falling below your traffic threshold ensures your pipeline stays focused on high-quality prospects.
Where to Get Demographic Data
Unfortunately, most CRMs don’t provide the kind of detailed data you need for Shopify-specific lead scoring. That’s where specialized tools come in.
- Storefront scanning: Tools that crawl Shopify storefronts can uncover key insights like installed apps, tracking pixels, theme type, and Shopify Plus status - all without manual research. This gives you a clear picture of a store’s tech stack and budget.
- Comprehensive Shopify data: Platforms like StoreCensus allow you to search across over 6 million Shopify stores using filters like revenue, tech stack, theme type, country, and growth signals. With this, you can build targeted lead lists that align with your ICP, identify Advanced tech maturity tiers, and validate traffic floors.
- Contact-level enrichment: For verified emails, decision-maker roles, and LinkedIn profiles, B2B enrichment tools are essential. Since only 34.2% of Shopify stores have verified contacts, enrichment often becomes a necessary second step. Prioritize leads with personal emails (e.g., firstname@domain) over generic ones like info@ or hello@ - personal emails are a better indicator of a decision-maker.
Building a Demographic Scoring Model for Shopify Leads
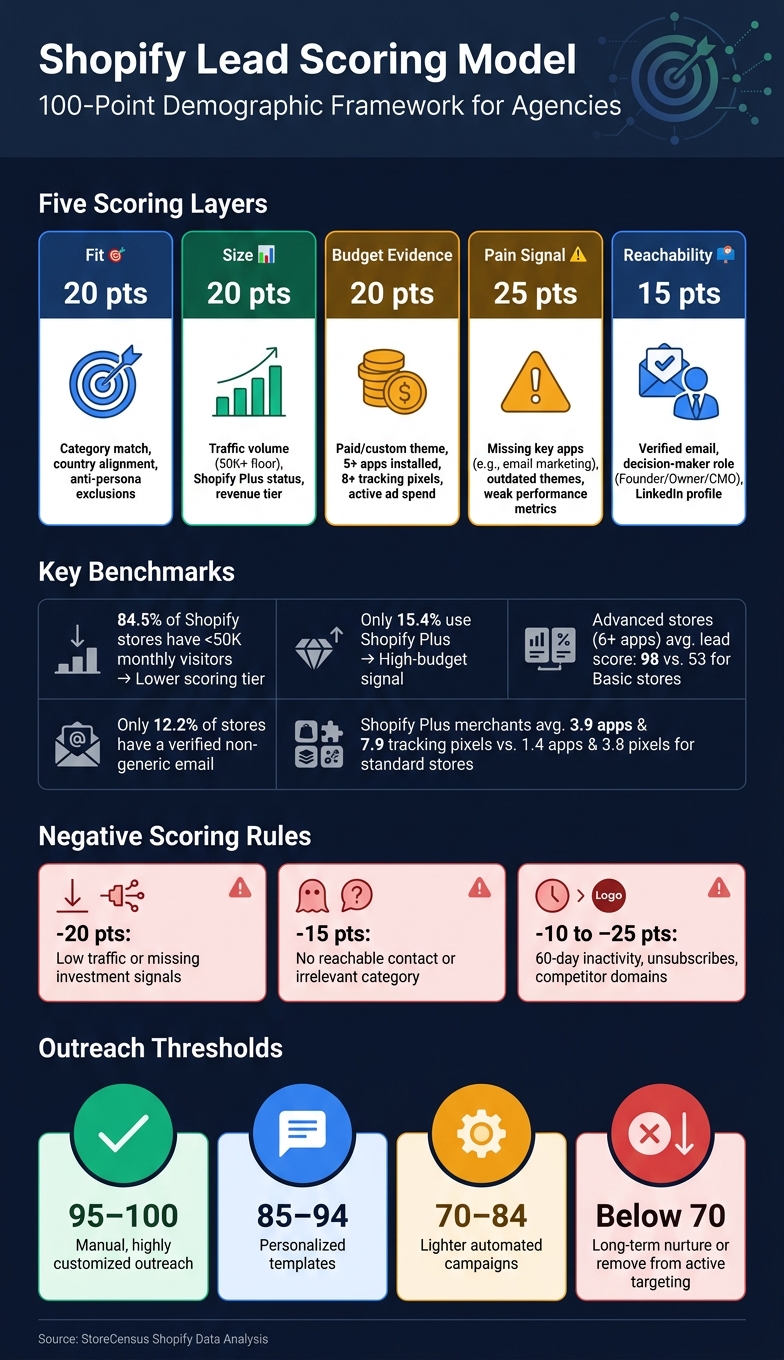
Shopify Lead Scoring Model: Demographic Fields & Point Values
Setting Up a Demographic-Only Scoring Scale
To create an effective scoring model, you can use a 100-point system divided across five key layers: Fit, Size, Budget Evidence, Pain Signals, and Reachability. Each layer evaluates a unique aspect of lead quality, ensuring a balanced approach where no single factor dominates the score.
| Scoring Layer | Max Points | What It Measures |
|---|---|---|
| Fit | 20 | Alignment with category and country, while avoiding anti-personas |
| Size | 20 | Factors like traffic volume, Shopify Plus status, and revenue tier |
| Budget Evidence | 20 | Indicators such as the use of paid/custom themes, 5+ installed apps, 8+ tracking pixels, or active ad spend |
| Pain Signal | 25 | Signs like missing essential apps (e.g., email marketing tools), outdated themes, or weak performance metrics |
| Reachability | 15 | Availability of verified email addresses, decision-maker roles, and LinkedIn profiles |
For instance, if a high-traffic Shopify store lacks a critical tool like an email marketing app, it would score strongly under Pain Signals, marking it as a promising lead.
Scoring Rules for Company and Contact Data
Assign point values based on store attributes. For example, Shopify Plus stores with high traffic should receive full points under Size, while those with moderate traffic can earn partial points. Similarly, stores using custom themes, with 5+ apps installed and 8+ tracking pixels, would score near the maximum under Budget Evidence.
For contact data, prioritize leads tied to a Founder, Owner, or CMO with a verified personal email. Leads with three or more verified decision-makers typically see higher response rates compared to those with a single generic contact.
Negative scoring is just as important to maintain quality. Deduct points for poor fits, such as -20 for low traffic or a lack of investment signals, and -15 for missing key contact details or irrelevant business categories. This ensures your pipeline stays focused on high-value prospects.
Once your scoring rules are set, integrate them into your CRM for automated lead evaluation.
Implementing the Scoring Model in Your Tools
In CRMs like HubSpot or Pipedrive, create custom fields for each scoring layer and use workflow automation to calculate a total score when a record is added or updated. Then, map these scores to your outreach strategies:
- 95–100: Trigger manual, highly customized outreach.
- 85–94: Use personalized templates for engagement.
- 70–84: Assign lighter automated campaigns.
- Below 70: Move these leads to a long-term nurture stream or remove them from active targeting.
Tools like StoreCensus can simplify this process. It allows you to pre-filter over 6 million Shopify stores based on traffic tier, Shopify Plus status, tech stack, theme type, and country. Stores that pass these filters already meet your Fit and Size criteria, so you can focus on scoring Pain Signals and Reachability. Refresh your scored lists every 30 days to keep your data accurate as merchant details change.
Combining Demographics with Behavioral Data
Why Demographics Alone Are Not Enough
Demographics provide a solid starting point for understanding potential leads, but they fall short when it comes to identifying purchase intent. A lead might fit the ideal customer profile perfectly, yet show no signs of readiness to buy. On the flip side, two leads with identical demographic profiles could be at completely different stages of the buying journey.
Jeff Pedowitz, CEO of The Pedowitz Group, puts it well:
"Firmographic fit measures who someone is, not what they intend to do. A VP of Technology... who opened one email 90 days ago is not a buyer. A director of operations... who has visited your pricing page four times this week might be."
Without factoring in behavioral data, sales teams risk wasting time on leads that may not convert. Studies reveal that sales representatives spend about 60% of their time on leads that ultimately go nowhere. This underscores the importance of integrating behavioral signals to identify which leads are genuinely moving toward a purchase.
Behavioral Signals to Watch for Shopify Merchants
For agencies working with Shopify merchants, two key types of behavioral signals are particularly insightful: direct engagement actions and tech signals.
- Direct engagement actions include activities like visiting pricing pages, requesting demos, or downloading case studies. These actions should be evaluated based on their intent level rather than sheer volume. For instance, a lead transitioning from reading a blog post to downloading a case study and then visiting the pricing page is clearly progressing toward a purchase. In contrast, someone who only reads blog posts is likely still in the early research phase.
- Tech signals can highlight gaps or challenges in a merchant’s setup. For example, if a high-traffic store has recently uninstalled its email marketing app, it could signal an immediate need for a solution. Similarly, a Shopify Plus merchant running paid ads without a retention tool might reveal an opportunity for improvement.
To ensure these insights remain relevant, apply time-decay logic. For example, using a 14–30 day half-life helps keep scores focused on current behavior rather than outdated interest .
When combined with demographic data, these behavioral signals create a much clearer picture of which leads are worth prioritizing.
Building a Combined Scoring Framework
To effectively prioritize leads, integrate behavioral signals with your existing demographic scoring model. Demographics establish a lead’s potential, while behavioral data determines how ready they are to engage. For example, a lead outside your Ideal Customer Profile (ICP) will never surpass a set threshold, no matter how much they engage. Within the qualified pool, behavioral signals help identify which leads deserve immediate attention.
Here’s an example of how a scoring framework might look:
| Signal Category | Point Value | Example Shopify Signals |
|---|---|---|
| High-Intent Behavioral | +15 to +25 | Demo requests, pricing page visits, recent app uninstalls |
| Mid-Intent Behavioral | +5 to +10 | Webinar attendance, case study downloads, email link clicks |
| Demographic Fit | +5 to +15 | Target category, Shopify Plus status, 50K+ monthly traffic |
| Negative Signals | -10 to -25 | 60-day inactivity, unsubscribes, competitor domains |
After scoring, apply thresholds to guide your outreach strategy. For instance:
- Scores of 95 or higher: Trigger fully manual, custom outreach.
- Scores between 85 and 94: Use personalized templates for outreach.
- Scores below 70: Place leads in a long-term nurture stream.
Conclusion: Refining Lead Scoring Over Time
A demographic lead scoring system isn’t a one-and-done project - it needs to adapt constantly. As we’ve discussed, integrating demographic and behavioral data is key, but keeping your lead scoring model up to date is what ensures it stays actionable. The Shopify ecosystem is dynamic - merchants are always installing new apps, upgrading to Shopify Plus, or tweaking their tech stacks. A score that made sense three months ago might not reflect the current reality.
Using Closed-Won Data to Improve Your Scores
Take a close look at your last 20–30 closed-won accounts to uncover patterns. Similarly, analyze deals you lost despite high engagement but low spending potential, and apply a penalty (e.g., –20 points) for leads that fall below key benchmarks. If your successful deals tend to score between 70 and 84, it may be time to recalibrate your scoring weights.
Focus on pain signals from those closed-won deals. For instance, identify which missing app categories, like reviews or analytics, were linked to conversions. If high-traffic stores consistently show these gaps, consider assigning them a higher point value in your scoring model moving forward.
"The model you build today will start decaying the moment you deploy it... The difference between teams that get value from lead scoring and teams that abandon it is not sophistication. It is maintenance." - Jeff Ignacio, RevOps Expert
Establishing a rhythm for maintenance is essential: review score distributions weekly, check conversion rates monthly, and conduct a full weight analysis every quarter. If your agency updates its ICP, pricing, or services, recalculate scores immediately. This disciplined recalibration ensures your model stays in sync with shifting market trends.
How StoreCensus Supports Ongoing Score Refinement
Keeping your scoring model accurate as the market evolves requires consistent updates. StoreCensus simplifies this process by providing real-time data on app installs, removals, and theme changes across millions of Shopify stores, making monthly re-scoring far more efficient.
StoreCensus does more than just offer updated data - it helps refine your demographic filters over time. As you analyze closed-won data, you’ll uncover which traffic levels, app setups, and Shopify Plus statuses are the strongest predictors of revenue. These insights can be directly translated into more precise filters, allowing your team to focus on stores that closely match your refined ICP instead of starting from scratch every quarter. Additionally, StoreCensus provides verified decision-maker contacts - founders, owners, and ecommerce managers - ensuring your model remains accurate across reachability, fit, and pain points. This continuous feedback loop strengthens the data-driven approach we’ve outlined throughout.
FAQs
What’s the fastest way to set my Shopify ICP using demographics?
The fastest way to pinpoint your Shopify Ideal Customer Profile (ICP) is by examining your last 50–100 closed-won deals. Look for patterns in firmographic and technographic details of your top customers, such as their industry, revenue range, and geographic location.
Using tools like StoreCensus, you can streamline this process. With access to over 2.5 million stores and 25+ data filters, StoreCensus helps you quickly identify high-potential prospects - eliminating the need for time-consuming manual research.
How do I weight traffic, Shopify Plus, and tech stack in a 100-point score?
To build a 100-point lead score, focus on metrics that indicate budget and growth potential. Here's how you can allocate points:
- Traffic (30–40 points): Prioritize stores with 10,000–50,000 visitors - this range often signals healthy interest and potential for growth.
- Shopify Plus Status (20–30 points): Being on Shopify Plus is a strong indicator of revenue and scalability.
- Tech Stack Quality (20–30 points): Look for premium tools, such as Klaviyo, which suggest a commitment to advanced marketing strategies.
Use the remaining points to evaluate secondary signals like ad activity and contact availability. For precise scoring, leverage data from StoreCensus to fine-tune your approach.
How often should I refresh and recalibrate lead scores with new data?
To maintain precise lead scoring, it's crucial to automate updates that reflect real-time changes, such as shifts in revenue or updates to a company's tech stack. Implementing score decay is another smart strategy - this involves reducing a lead's score after a period of inactivity (for example, cutting the score by 50% after 30 days without engagement). Additionally, re-checking contact information every 3–6 months ensures your data stays accurate. By pairing automated updates with periodic score adjustments, you can focus on leads that are current and ready for action.