Shopify Webinar Benchmarks: Registrants, Show Rate, SQLs
Webinar success hinges on targeting 50K+ monthly-visit merchants, tight pain-based topics, and measuring SQLs over sign-ups.


If I had to boil this down to one takeaway, it’s this: Shopify webinar performance usually gets better once I target stores above 50,000 monthly visits, use a tight pain-based topic, and judge success by SQLs, not just sign-ups.
Here’s the short version:
- Live show rate is the main attendance metric. In this piece, it means live attendance only, not total views.
- Stores under 50,000 monthly visits tend to have lower attendance and lower lead quality.
- The 50,000–200,000 visit segment is often the best starting point for volume and follow-up.
- 200,000+ visit stores usually bring better contact coverage, better attendance odds, and more sales conversations.
- A normal SQL target for agency webinars is tied to outcomes like:
- 3%–5% meeting bookings
- 5%–8% reply rate
- 1%–2% client close rate from qualified leads
- Higher-value merchant segments can support higher CPL, but low CPL alone does not mean the webinar worked.
- Topic matters a lot: broad education pulls list growth, while pain-based topics and live audits tend to drive more pipeline.
The article also makes one point I agree with: don’t look at any one number by itself. I need to read registrants, live show rate, SQL rate, and CPL together. A webinar with lots of sign-ups can still miss if the audience is weak.
Webinar Lead Generation: Step-by-Step System to Get Hot Leads Fast | WebinarNinja
Quick Comparison
| Segment | Show Rate Trend | SQL Trend | CPL Trend | Best Use |
|---|---|---|---|---|
| Under 50K monthly visits | Lower | Lower | Lower | Early-stage offers |
| 50K–200K monthly visits | Mid-range | Mid-range | Mid-range | Main prospecting tier |
| 200K–1M monthly visits | Higher | Higher | Higher | Mid-market growth |
| 1M+ monthly visits | Highest | Highest | Highest | Large-account pipeline |
I’d use these numbers as a planning baseline, then filter by merchant size, country, topic, and stack gaps before follow-up.
Registration-to-attendance benchmarks for Shopify webinars
Baseline show-rate ranges from B2B webinar studies
Merchant size and contactability are the best stand-ins for live attendance in Shopify webinars. Put simply: if you can reach the right person, you have a better shot at getting them to show up live. But reach alone doesn't do the whole job. The topic and the format still decide whether someone makes time for the session.
| Merchant tier | Reachability signal |
|---|---|
| Under 50K monthly visits | Verified-contact coverage: 28.5%–30.2% [2][3] |
| 50K–200K monthly visits | Verified-contact coverage: 38.3%–41.5%; contactability 84.1% [2][3] |
| 200K–1M monthly visits | Verified-contact coverage: 46.0%–48.5% [2][5] |
| 1M+ monthly visits | Verified-contact coverage: 54.7%–56.7% [2][5] |
How topic and format affect attendance
Topic specificity has a direct effect on attendance. Webinars built around concrete pain signals - like high traffic with no visible upsell or analytics layer - pull in merchants who are already thinking about making a change, which makes live attendance more likely [2][3]. Multi-channel reminders can push that further, especially when follow-up is segmented by role [1][3].
Those same attendance drivers also affect lead quality after the webinar. In other words, the people who show up tend to be the ones most ready to move.
Show rate by merchant size
Merchant size is the main attendance proxy, while topic and format work more like modifiers. Early-stage stores under 50K monthly traffic often have founders wearing five hats at once. So even if they register with real interest, live attendance can still slip.
The 50K–200K tier is the main volume market for Shopify prospecting and webinar registration. It combines 38.3% verified-contact coverage with 84.1% contactability [3], which makes it the most practical segment for reminder sequences and post-webinar follow-up. It's the sweet spot: big enough to produce volume, but still reachable enough to work.
At 200K–1M monthly traffic, verified-contact coverage climbs to 46.0%–48.5% [2][5]. Registrants in this band are also more likely to be professional buyers than solo founders. At 1M+ traffic, decision-maker concentration is highest, which makes these merchants especially attractive for high-intent, ROI-led topics [2][5].
Attendance matters most when it turns into sales conversations, which is the next benchmark to judge.
sbb-itb-61169e3
SQL rates and pipeline yield from webinar registrants
Attendance doesn't drive pipeline; SQLs do.
A webinar can pull in a big registration list and still lead nowhere. What matters is whether those people turn into booked calls, sales chats, and live deals.
Typical SQL conversion ranges
In agency funnels, an SQL usually means a booked meeting or a confirmed strategy call. Common targets are:
- 3%–5% meeting booking
- 5%–8% reply rate
- 1%–2% closed-client conversion from qualified prospects [1]
Track SQLs on their own, apart from registrants and attendees. Those groups tell you different things. Registrants show interest. Attendees show intent [2].
That distinction matters more than it first seems. A registration can be casual. Someone may sign up, get busy, and never think about it again. But when a person shows up live, they're signaling a stronger pull toward the topic.
SQL differences by merchant size and country
If you're trying to guess which webinar leads are most likely to turn into SQLs, size is the fastest filter.
Stores with more than 50K monthly traffic average a fit score of 96.9. Stores below 50K average 60.2 [2]. That's a big spread, and it makes traffic a solid first-pass screen when you're picking webinar targets.
Merchant size also affects how deals move through the sales process. Smaller brands often have one person calling the shots. Bigger brands? More layers, more stakeholders, and usually more time.
Merchants under $5M in annual revenue are often founder-led. The $5M–$20M band usually includes a CMO or Head of Growth. At $20M+, you're more likely to deal with a VP of Marketing or someone in the C-suite [1].
That shift changes sales cycle length too:
- 1–2 weeks at $500K–$2M
- 2–4 weeks at $2M–$10M
- 4–8+ weeks at $10M+ [1]
Use country for routing and follow-up, not as your main SQL benchmark. It helps with ownership and outreach timing, but it isn't your best signal for lead quality.
Which webinar topics drive the most sales conversations
Topic specificity is one of the clearest levers agencies can pull to improve SQL rate. Pain-driven topics bring in more SQLs than broad education sessions [2][4].
| Topic Type | Expected Lead Quality | Best For |
|---|---|---|
| Broad education | Lower intent, more noise | List building |
| Pain-signal specific | Higher intent, better SQL potential | Mid-market prospecting |
| Live audits / implementation workshops | Highest intent | ABM and enterprise pipeline |
This is where many teams miss the mark. A broad topic may fill the room, but a tighter topic tends to bring in people with an active problem. And active problems lead to sales conversations.
Among the largest qualified account pools for targeted webinar topics are fraud/payments (204,540 stores), post-purchase operations (192,791), and CRO (182,870) [4]. That gives agencies enough scale to run focused sessions without falling back on generic content.
Next, translate these quality signals into CPL and cost per opportunity by segment.
Cost per lead and segmented benchmark tables
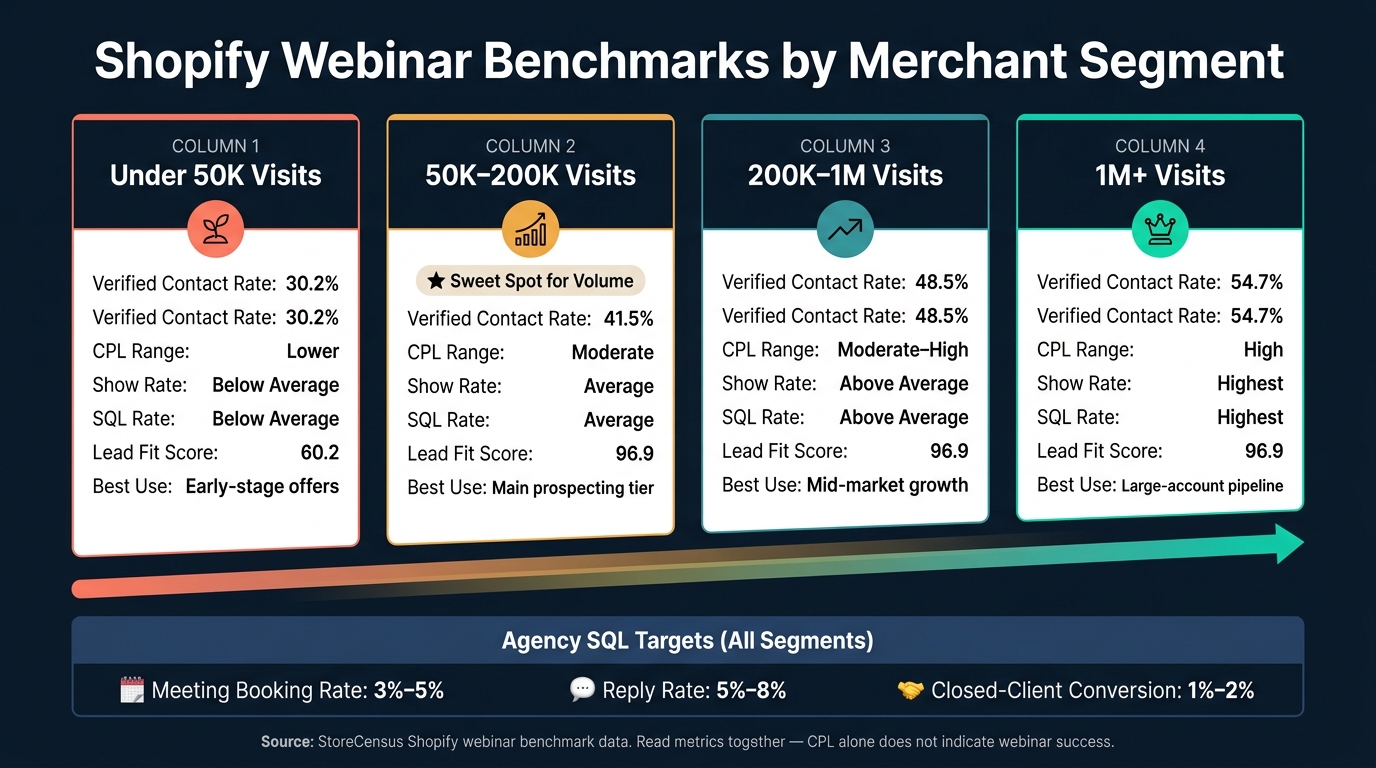
Shopify Webinar Benchmarks by Merchant Segment: Show Rate, SQL Rate & CPL
Cross-industry CPL ranges and how to read them
Higher-revenue Shopify merchants can handle higher CPLs because they can support larger retainers and longer LTV.
You can see that budget pattern most clearly in segment-level webinar performance.
Comparison table: CPL, show rate, and SQL rate by segment
| Merchant Segment | Approx. CPL Range | Est. Show Rate | Est. SQL Rate | Verified Contact Rate |
|---|---|---|---|---|
| Under 50K monthly visits | Lower | Below average | Below average | 30.2% |
| 50K–200K monthly visits | Moderate | Average | Average | 41.5% |
| 200K–1M monthly visits | Moderate–High | Above average | Above average | 48.5% |
| 1M+ monthly visits | High | Highest | Highest | 54.7% |
At higher traffic tiers, verified contact coverage improves. That cuts follow-up cost and helps your unit economics work better over time. A low headline CPL can look good on paper, but it can fall apart once your team has to do manual research and chase dead ends. That risk is even bigger when only 1.1% of all Shopify stores have a verified, non-generic outreach-role contact [3].
If your goal is better webinar unit economics, focus on traffic tier, tech stack maturity, and pain signals instead of raw registration volume [2].
Before follow-up, segment registrants by merchant quality signals. Use StoreCensus to sort registrants by revenue, traffic, tech stack, country, and growth signals before outreach.
Methodology, limits, and key takeaways
How to interpret the benchmark summary
Use the tables above as a screening tool first. Then check whether the segment matches your offer and whether the timing makes sense.
Think of these numbers as planning baselines, not fixed targets. They help you rank segments by likely fit, but they don’t replace offer fit or a clear pain signal.
There’s another catch: these benchmarks only reflect visible storefront signals. They don’t show backend tools, internal margins, or current agency relationships. So a store may look like a fit on the surface and still be out of market. [2]
Key points for agencies running Shopify webinars
Applied to the benchmarks above, the rule of thumb is pretty simple.
Set a 50,000 monthly traffic floor by default unless your offer is made for early-stage stores. Stores above that mark average a lead fit score of 96.9, versus 60.2 for stores below it. [2]
SQL rate comes down to segment quality. The best webinar audiences usually combine:
- merchant size
- geography
- a topic tied to a visible stack gap
High-scoring leads should go to manual research and custom messaging. Mid- to low-scoring leads are usually better suited for automated nurture or deprioritization.
These benchmarks - registrants, show rate, SQLs, and CPL - only mean something when you read them together. Don’t judge CPL by itself. Look at it next to merchant quality.
Refresh segments monthly, since Shopify tech stacks and merchant behavior shift fast. [2]
FAQs
What KPI should I prioritize first?
For Shopify agency lead generation, start with traffic volume.
Why? Because stores with at least 50,000 monthly visitors tend to be a much better signal of scale. It’s the clearest way to sort for stronger-fit leads while also improving your odds of finding verified contact details.
Once you’ve done that, score each prospect based on:
- revenue fit
- growth signals
- tech sophistication
- unit economics
- decision-maker accessibility
From there, put your attention on stores in the 50,000 to 200,000 monthly visitor range. That group often hits the sweet spot: large enough to need help, but not so large that they already have every gap covered.
It gets even better when a store shows a clear tech stack gap. That gives you a direct angle for outreach instead of a vague pitch that goes nowhere.
Why is 50,000 monthly visits the key cutoff?
The 50,000 monthly visits mark is a practical floor for agency and sales outreach. Stores under that line are often still in an earlier stage. That usually means smaller budgets, less setup on the back end, or contact details that haven’t been checked.
Filtering for 50,000+ monthly visits tends to improve lead fit, contact coverage, and access to decision-makers.
How should I pick the right webinar topic?
Pick a topic that lines up with the pain points and day-to-day needs of the merchant segment you want to reach.
Use data from StoreCensus to find gaps in a store’s tech stack, spot growth signals, gauge merchant size, review traffic, and see which apps they already use. Then build your webinar around practical, action-focused solutions for the merchants most likely to turn into high-quality leads.