Revenue Forecasting for Shopify Growth Signals
Rank Shopify stores weekly using traffic, app and product changes to predict near-term revenue and prioritize outreach.


You can use public Shopify store changes to guess who may buy agency help in the next 30 to 90 days. I’d keep it simple: estimate a store’s revenue band, watch for weekly changes, and score each account based on fit, stack depth, and buying signals.
Here’s the core idea in plain English:
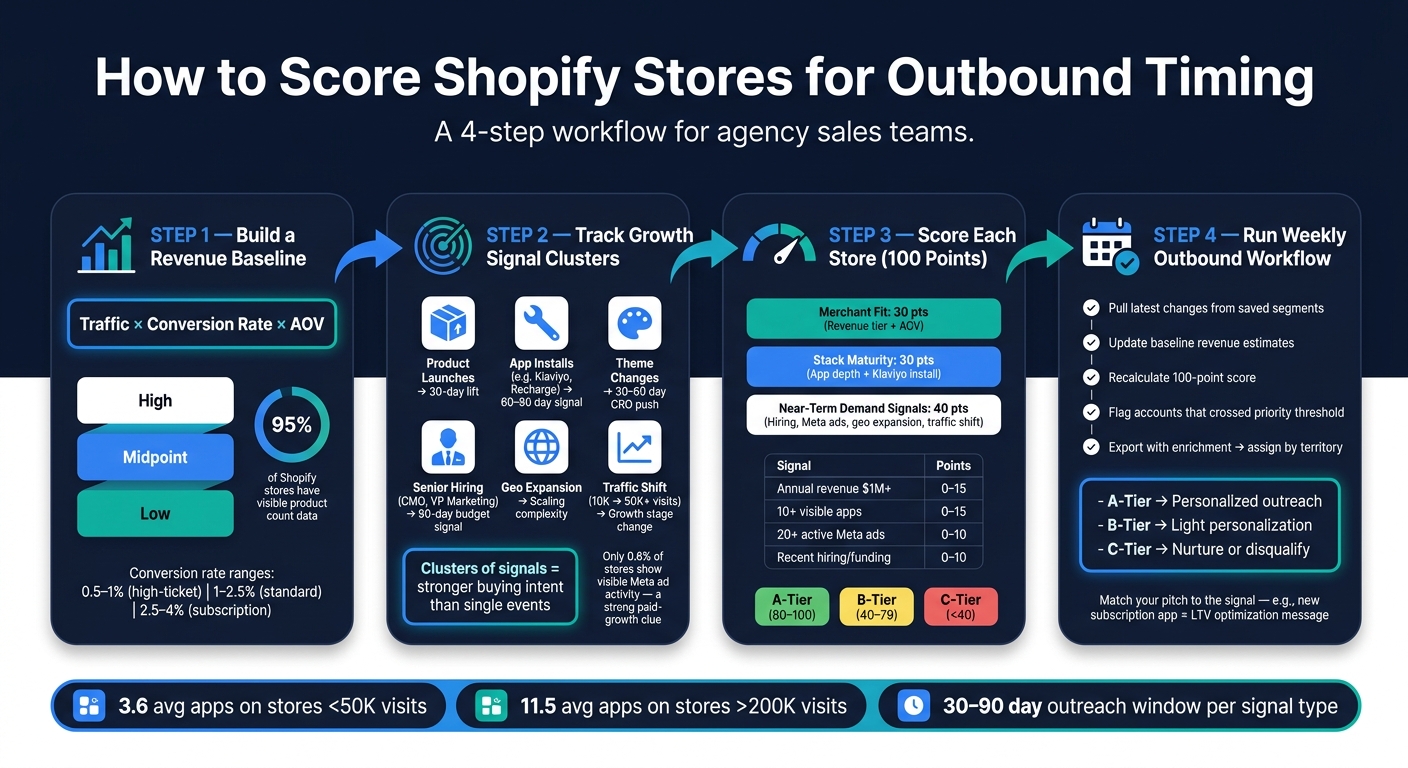
- I start with a rough revenue model: traffic × conversion rate × average order value
- I sort stores into low, midpoint, and high revenue cases instead of chasing exact numbers
- I watch six signal groups: product launches, app installs, theme changes, hiring, geo expansion, and traffic shifts
- I treat clusters of changes as stronger than one-off events
- I use a 100-point score to rank who looks most likely to spend soon
- I refresh the list every Monday or Tuesday and send outreach based on the trigger
A few numbers from the article stand out:
- About 95% of visible Shopify stores have product count data available
- Visible app counts rose from 3.6 apps on stores under 50,000 visits to 11.5 apps on stores above 200,000 visits
- Only 0.6% of stores in the cited study showed visible Meta ad activity, which makes that change a strong paid-growth clue
- A jump from 10,000 to 50,000 monthly visitors can point to a store moving into a new growth stage
What matters most is timing. If I see a merchant add products, swap themes, install tools like Klaviyo or Recharge, post a senior marketing role, or start running 20+ Meta ads, I’d treat that as a near-term sales signal, not just random store noise.
The article’s main takeaway is simple: don’t wait for merchants to ask for help. Build a weekly system that turns public changes into a ranked outbound list, then match your pitch to the signal you saw.
Shopify Growth Signal Scoring: 4-Step Revenue Forecasting Workflow
How To Forecast Ecommerce Revenue - Use This Simple 3 Metric Framework
sbb-itb-61169e3
1. Build a simple revenue forecast from public data
Start with the smallest model that gives you something useful, then tighten it up with signs from the store itself. A simple formula works well here: Estimated Revenue = Traffic × Conversion Rate × Average Order Value.
This is for ranking stores, not building a finance-grade forecast. Think of it as a practical shortcut. It helps you sort who looks small, who looks promising, and who may be worth a closer look. It gets better once you factor in what the store seems to be changing right now.
Set a baseline with revenue bands, traffic proxies, and catalog depth
Begin with broad revenue bands instead of trying to guess an exact number. For prospecting, it matters more to tell the difference between a store doing about $50K/month and one closer to $1M/month than to argue over a few thousand dollars.
To place a store into a traffic tier, look at traffic estimates, branded search demand, organic visibility, and social or ad activity. For AOV, sample a set of representative products, remove outliers, and model a low, midpoint, and high case.
Catalog depth also helps. So does the app stack. Both often climb before ad spend does. Product count data is available for about 95% of visible Shopify stores [3], which makes it an easy proxy for catalog depth.
Once you have that baseline, adjust it using what the storefront itself is telling you.
Adjust the baseline with Shopify-specific quality signals

After you’ve made a rough call on traffic and AOV, update your conversion rate assumption based on store quality signals.
A simple range is enough:
- 0.5%–1% for high-ticket stores or stores with lower conversion
- 1%–2.5% for established consumer brands with standard ecommerce flows
- 2.5%–4% for high-intent products, repeat-purchase categories, or subscription models
Use those ranges as your starting point, then tweak them with signal-based adjustments.
App stack depth can hint at store maturity. Publicly visible installed apps tend to climb with traffic, from 3.6 apps for stores under 50,000 visits to 11.5 apps for stores above 200,000 visits [3]. Visible Meta ad activity is uncommon - only 0.6% of stores in that study showed it [3] - so it’s a strong sign that the store is putting money into acquisition.
Report your forecast in low, midpoint, and high cases, then attach a confidence label. The goal is simple: decide whether the account deserves immediate outreach using Shopify brand prospect lists. It’s not to pin down exact quarterly revenue. Also, flag B2B and wholesale stores on their own. They may have low traffic and still produce high revenue because order sizes are much larger.
2. Convert growth events into forecast inputs
Track deltas, not snapshots.
A single change can be noisy. But when you see a cluster of launches, stack changes, and hiring, the signal gets much stronger. That’s what you want to use to adjust the baseline revenue band and confidence level from Section 1.
Map product, app, and theme changes to demand uplift
Rapid product launches are one of the clearest short-term signals you can find. Treat them as 30-day inputs. If a store adds Recharge or Yotpo, read that as a 60- to 90-day scaling signal. It often means the team is moving past routine operations and putting money into growth. A theme refresh usually points to a CRO or redesign push, with a similar 30- to 60-day demand window.
| Signal Type | What Changed | Likely Forecast Impact |
|---|---|---|
| Rapid product launches | New SKU or product line added | Immediate 30-day lift |
| Stack upgrade | Adding Recharge, Yotpo, or similar growth tools | 60- to 90-day build |
| Theme refresh | New theme, redesign, or CRO rebuild | 30- to 60-day demand uplift |
| Ad activity | 0 → 20+ active Meta ad variations | Budgeted monthly spend |
| Stack contraction | Removal of subscription or loyalty apps | Possible slowdown |
Visible Meta ad activity is one of the clearest budget tells. If a store goes from 0 to 20+ active Meta ad variations, that brand is already spending and is often more open to spending more.
Product and app changes tend to move the near term. Hiring, expansion, and traffic shifts usually shape the next budget cycle.
Map hiring, geo expansion, and traffic shifts to budget timing
Hiring is a strong budget signal. When a store posts a CMO, Head of Growth, or VP of Marketing role, it often means the brand is moving from survival mode to scaling and has the budget to invest in external expertise [1][2]. Treat that as a meaningful 90-day input.
Geo expansion matters too. If a brand adds international shipping or enters new regions, that points to more operational complexity and larger-scale growth [2]. Traffic shifts tell a similar story. A move from 10,000 to 50,000 monthly visitors suggests a brand is moving from traction to scale, while 200,000+ usually means it’s already established [2].
The pattern to watch is simple: when hiring, expansion, and traffic changes show up together, approach the account. Then feed those signals into your revenue band update and use those time horizons to score the account in the next step.
3. Score stores by near-term demand
Use a 100-point score to rank accounts by fit, tech maturity, and near-term intent. That way, your 30- to 90-day revenue forecast becomes a ranked call list instead of a loose guess.
The idea is simple: use the same signals from the prior step, then score them based on budget, readiness, and urgency. That score gives your team a weekly way to sort accounts by how soon demand is likely to turn into spend.
Use a 100-point scoring model for fit, maturity, and intent
Split the 100 points across three buckets: 30 points for merchant fit, 30 points for stack maturity, and 40 points for near-term demand signals.
Merchant fit answers the budget question. Revenue tier and AOV tell you whether the store can afford your service.
Stack maturity tells you if the store is set up to act. Stores with deeper app stacks usually point to more operational complexity and a stronger need for optimization services [3].
Near-term demand signals get the most weight at 40 points because they answer "why now?" Recent senior hiring, funding, or geo expansion should score highest [1]. The weights should match what your agency sells. For example, an email agency should give more points to Klaviyo migrations, while an ads agency should put more weight on active Meta ad volume [2].
Document the rubric so reps can score consistently
Write down exactly where each data point comes from and what earns which points. If the rules live only in someone's head, scores will drift fast.
| Signal | Data Source | Point Range | Rationale |
|---|---|---|---|
| Annual revenue $1M+ | StoreCensus | 0–15 | Confirms budget to sustain a retainer [1] |
| AOV > $100 | Live product pages | 0–15 | Higher AOV means more aggressive marketing spend is viable [1] |
| 10+ visible apps | StoreCensus | 0–15 | Signals operational complexity and optimization need [3] |
| Klaviyo installed | Storefront scan | 0–15 | Shows investment in retention infrastructure [1] |
| 20+ active Meta ads | Meta Ad Library | 0–10 | Proves active spending and intent to scale traffic [1] |
| Recent hiring or funding | LinkedIn / Crunchbase | 0–10 | New leadership or capital often precedes new agency contracts [1] |
| Geo expansion | StoreCensus | 0–10 | International shipping or new regions signals larger-scale growth [2] |
| Traffic shift (10K → 50K+ monthly visitors) | StoreCensus | 0–10 | Indicates a store moving from traction to scale [2] |
Not every signal deserves the same level of trust. A detected pixel or app is a confirmed technical fact, but it does not prove current spend or usage. A traffic estimate is directional [3]. Reps should note that difference when scoring, so they don't treat rough estimates like verified facts.
If you want a simpler version, group accounts like this:
- A: 80–100
- B: 40–79
- C: Below 40
Once the rubric is in place, refresh it weekly and send the highest-scoring accounts into outbound first.
4. Run the workflow in StoreCensus and weekly outbound
With scores set, the next step is simple: turn them into a weekly system. That’s how a score stops being a spreadsheet exercise and starts becoming a live pipeline.
Find and monitor stores with StoreCensus
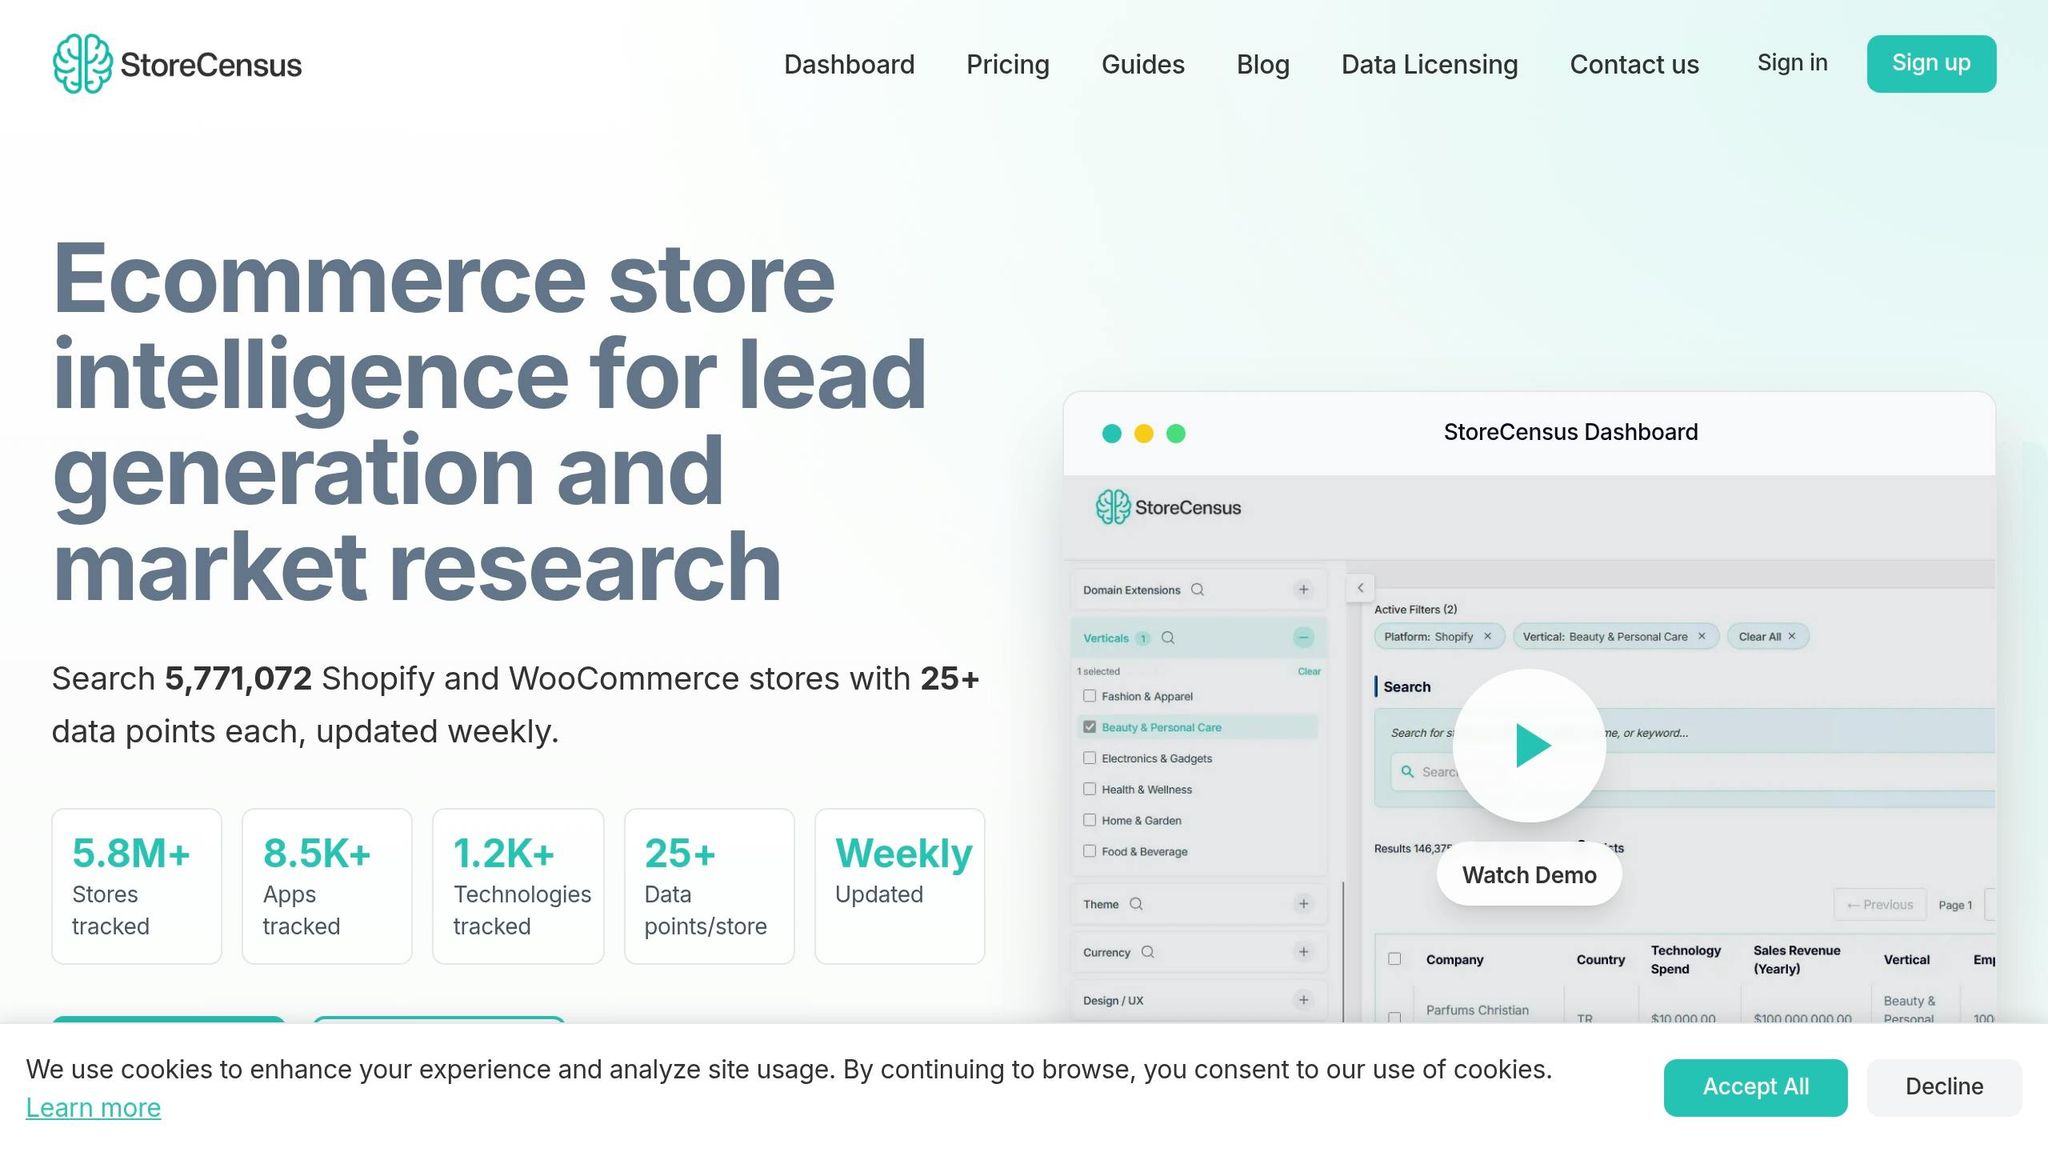
A score is only as good as the data behind it. If the data gets old, the score does too. StoreCensus helps you keep that data current by turning your forecast into a monitored account pipeline.
Start by turning your ICP into clear filters: revenue band, such as $500,000–$5,000,000; platform, like Shopify or WooCommerce; key apps, such as Klaviyo, Recharge, and PageFly; theme type; and target geographies like the United States, Canada, or the UK.
Once that’s done, save the search as a named segment, such as "U.S. Shopify mid-market brands on Klaviyo", and switch on change monitoring. From there, StoreCensus tracks things like:
- app adds
- theme changes
- traffic shifts
- catalog expansion
- geo expansion
That matters because buying intent often shows up in these changes first. A store that moved from a free theme to a custom theme, or just added a subscription app, is likely in an active buying cycle. StoreCensus brings that to the surface fast, so you can act while the window is still open.
Refresh scores weekly and route the top accounts first
Pick one fixed time each week. Monday or Tuesday morning works well. Then run the same five-step process every time.
Pull the latest changes from your saved StoreCensus segments. Update the baseline revenue estimate for any store where traffic or catalog signals changed. Recalculate the 100-point score. Flag any account that made a meaningful jump or crossed your priority threshold. Then export those flagged accounts with full enrichment, including revenue band, tech stack, growth signals, and decision-maker contacts, and assign them by territory or service line.
This gives your team a ranked list at the start of each week. Accounts above the priority threshold go first. Accounts with weak fit or stale signals get paused. Everything in the middle stays in nurture until a new signal appears.
After the weekly score refresh, route outreach based on the signal that changed. Each message should mention the trigger. If a store just added a subscription app, send a note about LTV optimization. If a store expanded into a second country, lead with localization and market expansion. Use the Discovery → Close statuses to move accounts as scores shift, so the whole workflow stays in one system.
Conclusion: Use growth signals to forecast revenue and time outreach better
Now it comes down to execution. Following proven Shopify store guides can help streamline this process.
This workflow is meant to prioritize outreach, not to predict exact revenue. The goal is simple: use public signals to rank which Shopify stores deserve your attention this week.
Start with a baseline. Then layer in growth signals tied to expansion, score each store, and refresh the list every week so your outreach hits while intent is still fresh.
Think of the estimates as directional tiers, not hard numbers.
- A-tier accounts get personalized outreach
- B-tier accounts get lighter personalization
- C-tier accounts get disqualified or moved into nurture
Run the list each Monday, update scores using fresh signals, and send first touches while the signal is still warm.
FAQs
How accurate are public revenue estimates?
Public revenue estimates are directional, not exact. They’re built from outside signals, not private transaction records.
That matters because the method changes the result.
Traffic-based models and browser spy tools often come with a 20% to 50% margin of error. Multi-factor models like StoreCensus can get closer, with accuracy in the 70% to 85% range.
Store size also plays a big role. Estimates tend to be more reliable for larger stores, where there’s more data to work with. For smaller stores, the numbers can swing more.
The best way to use these estimates is for relative comparison, not exact accounting. They can help you gauge one store against another, but they shouldn’t be treated like a company’s internal sales report.
Which growth signals matter most first?
Traffic volume, conversion rate, and average order value matter first because they give you a baseline for monthly revenue estimates. Once you have that, add signals like advertising activity, tech stack complexity, and review velocity to get closer to the mark - often within 20%–30%.
For growth prospecting, start with stores getting 50,000+ monthly visitors. Then move stores with signs of active investment to the top of the list, like new app installs, theme changes, or higher ad counts.
How should I use the weekly score in outreach?
Use the weekly score to cut manual research and sort outbound faster. Filter prospect lists for a Lead Fit Score of 80+ so your team can focus on stores that line up with your ideal customer profile across tech stack, app count, pixel count, and revenue signals.
Put high-scoring stores at the top of the list for immediate, high-touch outreach. Use lower-scoring leads for CRM enrichment or a weekly batch review.