5 OpenCart AR Use Cases Agencies Can Pitch
Five practical OpenCart AR pitches for agencies: room preview, virtual try-on, configurators, B2B planning, and virtual showrooms.

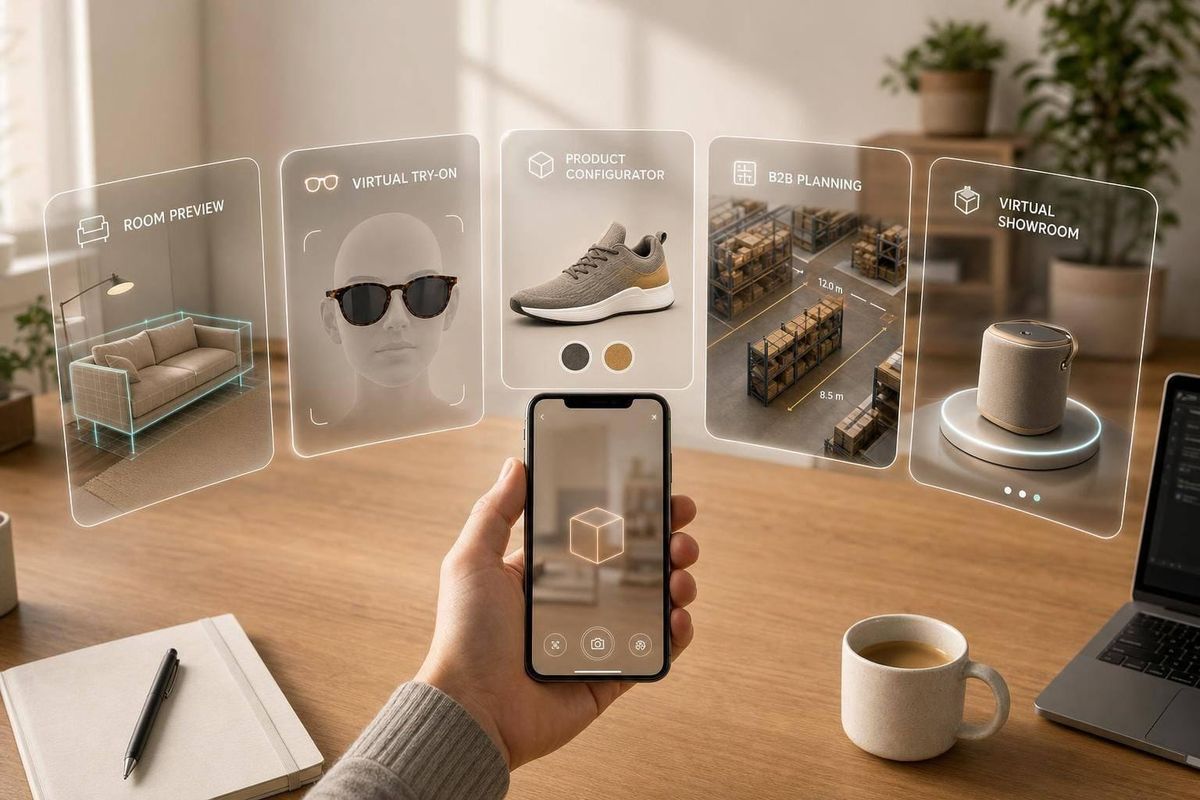
If I had to boil this down to one point, it’s this: OpenCart AR sells best when I tie it to one buying problem and one product type. In this piece, I cover five pitches agencies can sell now: room preview, virtual try-on, AR configurators, B2B space planning, and virtual showrooms. I also show where each one fits, what it can cost, and what results merchants usually care about most, like conversion, AOV, sales cycle speed, and returns.
AR is not just a flashy add-on anymore. In the article, the case is tied to numbers: AR-enabled products can convert at 94% higher rates and can cut returns by 22% to 40%. That’s why I’d start with products where shoppers get stuck on fit, scale, style, or layout.
Here’s the short version of what matters most:
- Furniture and home goods: best when shoppers need to see if an item fits a room
- Eyewear and accessories: best when shoppers need to see fit on their face
- Custom products: best when buyers need to see option combinations before checkout
- B2B equipment: best when reps and buyers need to test fit, clearance, and layout
- Virtual showrooms: best when a merchant wants to cut showroom or demo dependence
I’d also keep the build simple at first:
- start with 10 to 20 SKUs
- use WebAR when possible so shoppers do not need an app
- prep GLB and USDZ files early
- track viewer impressions, launches, session time, and AR-assisted add-to-cart
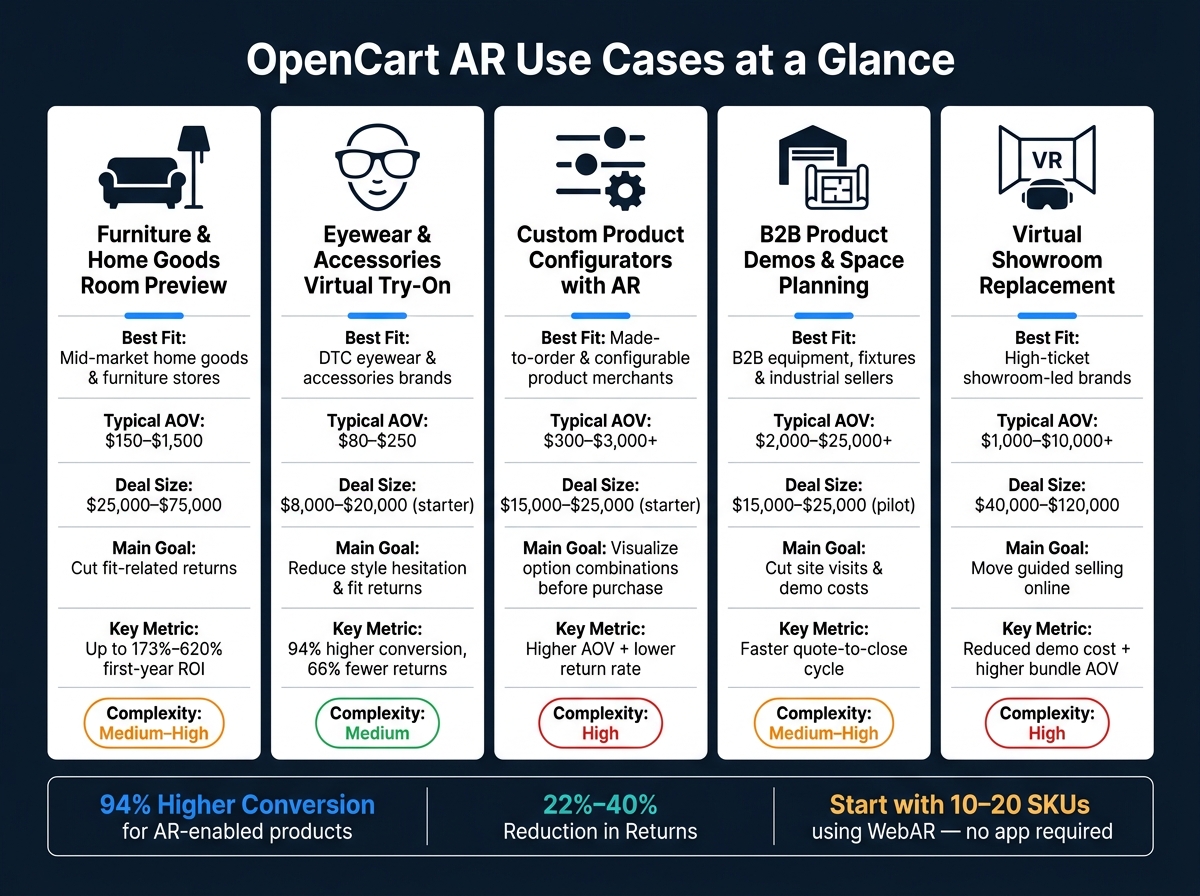
OpenCart AR Use Cases: Deal Sizes, Best Fits & Key Metrics
Quick Comparison
| Use Case | Best Fit | Typical Deal Size | Main Goal |
|---|---|---|---|
| Furniture room preview | Home goods and furniture stores | $25,000–$75,000 | Cut fit-related returns and help shoppers buy with more certainty |
| Eyewear virtual try-on | DTC eyewear and accessories brands | $8,000–$20,000 starter | Help shoppers judge face fit and style |
| AR configurators | Stores selling made-to-order or option-heavy products | $15,000–$25,000 starter | Show the exact final product before purchase |
| B2B demos and space planning | Equipment, fixtures, and industrial sellers | $15,000–$25,000 pilot | Cut site visits, demo costs, and fit mistakes |
| Virtual showroom | High-ticket brands with showroom-led sales | $40,000–$120,000 | Move guided selling online and sell bundles or room sets |
My takeaway: if you pitch AR as a fix for a clear shopping problem, it is much easier to scope, price, and sell.
sbb-itb-61169e3
What OpenCart Agencies Need Before Pitching AR
Before you pitch AR, make sure the merchant can support it without a full rebuild. Start with an audit of the OpenCart setup. The goal is simple: match the build to the budget, the catalog, and the team's dev bandwidth so you don't walk into scope creep or leave gaps in pricing.
OpenCart Modules and Custom Integration Options
The right setup depends on budget, catalog complexity, and internal dev resources.
- $5,000–$15,000: an off-the-shelf viewer module. This is the fastest option to launch and a good way to test AR on a smaller group of SKUs.
- $20,000–$40,000: a WebAR product module. This adds a "View in your space" button right on the product page.
- $50,000+: a custom SDK integration. This fits cases with multi-product scenes, AR configuration, or B2B quoting flows, especially when ERP, PIM, or custom pricing logic is part of the stack.
Also, check whether product/product.twig has been heavily customized. If it has, AR triggers on that template will need extra QA, and that work should be priced into the scope.
3D Asset Production and File Format Workflow
Most AR delays don't start in development. They start in the asset pipeline.
Set the asset standard early: accurate dimensions, 50,000 polygons or less, GLB files under 5–10 MB, 512×512 or 1,024×1,024 textures, plus both GLB and USDZ exports. When agencies lock this in from the start, they can quote per-SKU costs with far less guesswork. For furniture, that usually lands around $150–$500 per model, depending on complexity.
Mobile UX and Analytics Requirements
Placement matters. Put the AR button above the main image and above the fold so shoppers don't have to hunt for it. If AR isn't supported, fall back to a 3D view or 360° view instead.
Track four core events from day one:
- viewer impression
- launch
- session duration
- AR-assisted add-to-cart
Without that data, it's tough to tell whether AR is doing its job or just looking nice in a demo.
Which Product Categories to Prioritize First
Start with SKUs that have high AOV and lots of size-related returns. That's where AR tends to make the most sense.
Furniture and large home goods are the clearest fit. Item prices often fall in the $800–$3,000+ range. Outdoor products, like grills, patio sets, and pergolas, are close behind.
A small pilot works best here. Roll AR out on 10–20 SKUs, measure the lift, then use those results to branch into nearby categories like appliances, lighting, or configurable products. That kind of data makes expansion much easier to sell.
With scope, assets, and tracking nailed down, the five pitches below are much easier to price and line up with the right merchant.
1. Furniture and Home Goods Room Preview
This is the clearest first pitch because furniture AR tackles the exact-fit problem that makes shoppers pause before they buy.
Best-fit merchant profile
Best fit: furniture and home goods merchants with high-AOV catalogs, lots of products that need to fit a room, and strong product pages where return risk is high.
Typical deal size in USD
Typical project: $25,000–$75,000. Larger first-year builds usually land in the $40,000–$150,000 range.
Core AR implementation model
Start with the SKUs that drive the most revenue and the most return risk. Then connect GLB/USDZ assets to OpenCart product IDs through a custom module or asset layer.
Make the "View in Your Room" CTA easy to spot. For desktop users, route them into AR with a QR code or SMS link. Inside the AR view, shoppers can place, move, and rotate furniture in their own space, with floor-snapping so positioning feels more true to life.
Track the actions that matter for this use case:
- Room placement
- Session duration
- Add-to-cart events
- Purchase events
Primary revenue or margin impact
Furniture ecommerce often deals with high online return rates because shoppers can't tell whether an item will fit their space. A furniture AR ROI model puts first-year ROI at 173%–620%, with payback tied to higher conversion and fewer returns.[1]
And the savings can add up fast. Each avoided bulky-item return can save $100–$300 in shipping, restocking, and lost margin.
When the purchase hinges on fit on a person, not in a room, the next pitch is virtual try-on.
2. Eyewear and Accessories Virtual Try-On
When a sale comes down to how something fits on a person’s face, a room preview won’t do the job. This is where virtual try-on makes more sense. For eyewear, AR moves the conversation from will this look good in my space? to will this actually fit my face? That shift cuts down on guesswork and helps shoppers pick frames with more confidence, which can also mean fewer returns.
Best-fit merchant profile
This works best for eyewear brands with an average order value of $80 to $250, a catalog of 50 to 100+ SKUs, and a steady stream of return complaints tied to fit or style mismatch. Stores with 20,000+ monthly sessions should be the first target, since traffic at that level makes any lift much easier to spot.
Typical deal size in USD
Starter builds for 20 to 50 SKUs usually land in the $8,000 to $20,000 range, with monthly retainers of $1,000 to $2,500.
Mid-market projects often fall between $25,000 and $60,000. Enterprise builds can reach $75,000 to $150,000+.
Core AR implementation model
The usual setup is a browser-native WebAR widget placed right on product pages. It reads OpenCart variants, swaps GLB/USDZ assets based on color and style, and uses face-landmark tracking so frames sit in the right spot on the shopper’s face.
On the store side, admin controls matter a lot. Merchants should be able to map new SKUs to AR assets on their own, without pulling in a developer every time the catalog changes.
Primary revenue or margin impact
Snap-cited research reports 94% higher conversion and 66% fewer returns for AR users.[2] That’s a big selling point.
In eyewear, even a 10% to 25% drop in return rate can protect margin in a meaningful way. So the pitch is pretty simple: higher conversion on the front end, lower return pressure on the back end. That makes the business case easy to explain.
If the buyer needs more than fit and style, the next pitch is AR-powered configuration.
3. Custom Product Configurators with AR Visualization
If the sale hinges on style and body fit, try-on usually does the job. If it hinges on combinations, a configurator is the better play.
That’s why customizable products need a configurator, not just a static photo. For OpenCart agencies, this is one of the strongest mid-market offers when a merchant already sells product options but still struggles with the visualization gap.
Best-fit merchant profile
This works best for merchants selling higher-ticket configurable products like custom furniture, cabinets, signage, or made-to-order goods. In most cases, their average order value falls between $200 and $2,000, and they already use OpenCart product options. That makes the upgrade easier to pitch and easier to build.
The problem is pretty simple: shoppers can choose options, but they still can’t see how the final mix will look in real life.
Once a merchant has enough SKU options and enough visual assets, the project turns into a rules-and-rendering job, not a storefront redesign.
Typical deal size in USD
Starter builds for one product line usually land in the $15,000–$25,000 range. Multi-family builds with analytics and quote integration can reach $40,000–$60,000+.
Core AR implementation model
Use a web configurator on the product page first, then launch AR from the final configuration. Each option set needs to map to the right 3D asset. From there, track the signals that matter:
- AR engagement
- Option selection
- Add-to-cart events
Primary revenue or margin impact
AR configurators tend to shift three numbers that matter most: conversion rate, average order value, and return rate.
When buyers can view the exact configured product at real scale in their own space, they make decisions with more confidence. They’re also more likely to upgrade to premium finishes or add add-on components. That’s the core pitch:
- Higher conversion
- Higher AOV
- Lower returns
When the buyer needs to picture the product inside a larger operating setup, the next pitch moves from configuration to demonstration.
4. B2B Product Demos and Space Planning
When a buyer needs to check if equipment will clear a doorway, fit between support columns, or leave enough room for a forklift lane, a product photo isn't enough. AR lets buyers test fit before they commit, which cuts down on demo trips and install mistakes.
When the sale comes down to fit, clearance, and layout, AR stops being a merchandising tool and becomes a pre-sales check.
Best-fit merchant profile
Best fit: OpenCart merchants selling large, space-sensitive B2B products like warehouse racking, HVAC units, industrial machinery, kiosks, or lab equipment. These buyers already move through reps, quotes, and site visits, so AR fits into the current sales process instead of trying to replace it.
There's another reason this setup works well: many of these merchants already have CAD or BIM files. That can shorten 3D production time and make project pricing easier to scope.
Core AR implementation model
Use a product viewer with a floor-plan planning layer. A prospect scans a QR code or opens a link, then places a scale-accurate 3D model inside their facility. If the project involves multiple units, a planner can arrange several SKUs on a floor plan before launching AR.
For sales follow-up, track:
- Placed SKUs
- Session length
- Account-level usage
On the backend, link each 3D model to an OpenCart product ID and include exact dimensional metadata. AR session data can also feed straight into quote workflows.
Typical deal size in USD
Pilot work usually starts at $15,000–$25,000. A rollout covering 5 to 10 flagship SKUs often lands at $20,000–$40,000. Larger builds across more than one region can reach $50,000–$150,000+, with monthly support at $2,000–$8,000.
Primary revenue or margin impact
AR cuts demo travel, sample shipping, and install rework caused by fit errors. It can also help reps close deals faster and sell more accessories or added units once buyers can see the layout in their own space.
A simple way to measure impact is to compare quote-to-close rate and average order value for AR-assisted deals.
If the merchant wants AR to take the place of a physical demo environment, the next pitch is a virtual showroom.
5. Virtual Showroom Replacement
When the goal isn’t just helping someone see a product in their space, but replacing the showroom itself, AR starts to act like a full sales environment.
A virtual showroom lets buyers walk through a curated product lineup inside a life-size showroom scene. That can reduce or replace physical showroom visits and trade shows. The focus shifts from showing one item at a time to selling multiple items together through a guided buying path. For merchants that still depend on in-person selling to close deals, this opens a way to move that process online without rebuilding the entire storefront.
Best-fit merchant profile
This setup works best for mid-market merchants with $5 million to $50 million in annual online revenue, an AOV above $500, and calls to action like Find a showroom, Book a demo, or Request a consultation. Those are strong signs that in-person selling is slowing things down and that the merchant is already looking for another way to handle it.
Core AR implementation model
A smart starting point is PDP-level AR for single products. From there, merchants can add guided scenes for bundles or full room sets.
For larger accounts, a hybrid microsite often makes sense. In that model, OpenCart handles commerce, while a separate showroom front end runs the experience. Deep links then send shoppers back to cart and checkout. It’s a clean split: one side handles buying, the other handles the sales journey.
Typical deal size in USD
Typical implementation fees fall between $40,000 and $120,000, plus $150 to $500 per SKU for assets and $3,000 to $10,000 per month for support. Larger builds with multiple scenes or quote integration can go past $150,000.
Primary revenue or margin impact
A virtual showroom can improve conversion, push AOV higher through bundles, and cut cost-to-sell by reducing demo visits and shortening the sales cycle.
Key metrics to track include:
- AR-assisted vs. non-AR conversion
- AOV
- Return rate
- Demo-related cost reduction
For agencies, the next move is figuring out which merchants have the traffic, revenue, and in-person sales friction to justify this kind of build.
Buyer Fit and Deal Size at a Glance
Not every OpenCart merchant needs the same AR setup. This table helps you qualify accounts faster and match the scope to the buyer. After that, the next move is simple: find Shopify brand prospect lists or other merchant data that fit these ranges.
Start with AOV as your first filter. Below about $75, basic 3D usually does the job. In the $80–$250 range, virtual try-on and some furniture use cases start to make sense. At $300+, configurators, B2B demos, and virtual showrooms are often a better fit.
Here’s the fastest way to connect the use case to the account.
| Use Case | Best-Fit Merchant Type | Typical AOV | Main Pain Point | Implementation Complexity | Typical Deal Size |
|---|---|---|---|---|---|
| Furniture & Home Goods Room Preview | Mid-market home goods brands | $150–$1,500 | High returns and uncertainty about fit and scale | Medium–High | $15,000–$50,000 |
| Eyewear & Accessories Virtual Try-On | DTC eyewear brands | $80–$250 | Style hesitation and fit confidence | Medium | $10,000–$35,000 |
| Custom Product Configurators with AR | Configurable or made-to-order merchants | $300–$3,000+ | Customers struggle to visualize options, which leads to errors | High | $30,000–$100,000+ |
| B2B Product Demos & Space Planning | B2B equipment and fixtures sellers | $2,000–$25,000+ | Resource-heavy pre-sales and costly on-site demos | Medium–High | $25,000–$80,000+ |
| Virtual Showroom Replacement | High-ticket showroom-led brands | $1,000–$10,000+ | Physical showroom overhead and limited remote selling | High | $40,000–$150,000+ |
Complexity goes up as asset count grows and as the experience connects more deeply to OpenCart pricing and options logic.
A common oversell is pitching a full virtual showroom to a merchant that only needs a basic 3D viewer. The flip side happens too: offering a basic viewer to a B2B equipment seller closing $15,000 AOV deals, when space-planning AR could shorten the sales cycle in a meaningful way. Use these ranges to score merchants before outreach.
How to Find OpenCart Merchants Ready to Buy AR
Use the buyer-fit table as a filter. Then rank merchants by the pain AR can take off their plate. The table above tells you what to pitch. This section is about who to go after first.
Signals That an OpenCart Merchant Is Likely to Buy AR
Start with merchants where returns come from fit, scale, or style mismatch. That’s usually where AR has the clearest sales case.
Then look for signs like:
- size guides and fit FAQs
- strong lifestyle imagery
- broad SKU ranges with multiple finishes or configurations
Those clues often point to use cases like furniture preview, virtual try-on, configurators, B2B demos, or replacing part of the showroom experience.
Multi-location sales teams and small showroom footprints are also strong signals. In those cases, AR becomes a practical sales tool. It helps when a merchant still depends on in-person selling to close deals but doesn’t have enough physical space to grow that model.
Turn those traits into a prospect list before outreach.
Using StoreCensus to Define AR-Ready Merchant Criteria
StoreCensus lets you test those traits at scale using Shopify store guides as a blueprint, then apply the same filters to OpenCart targets.
Use it to study which merchant traits line up with AR buying behavior, such as high AOV, multiple locations, strong lifestyle imagery and video, and growth signals. Then use those same patterns in your OpenCart prospecting.
Conclusion
OpenCart AR is a revenue pitch. It works when you tie it to a specific product category and a specific buying problem.
A merchant selling sofas doesn't need "AR innovation." They need fewer returns from shoppers who couldn't tell whether a couch would fit in their living room. That's the gap between a generic AR demo and a pitch a merchant will pay for.
Each use case connects to a different friction point: room fit, face fit, option clarity, layout certainty, or showroom replacement. The buyer profile changes from one case to the next, but the logic stays the same: AR has to fix a real problem.
Tie each pitch to one main outcome:
- returns
- add-to-cart rate
- AOV
- sales cycle speed
- reach
Vague pitches tend to stall. Specific pitches are much easier to scope.
Once the use case is clear, scope should match merchant maturity. Start with a 5- to 10-SKU pilot for smaller stores, then move to a phased rollout for merchants with stronger data and budget.
Pick one use case, define the merchant fit, and turn it into a repeatable AR offer. Then use StoreCensus to find merchants whose catalogs and growth signals line up.
FAQs
Which AR use case should I pitch first?
Lead with the use case that has the clearest buy now intent or the most direct revenue risk. A smart place to start is with fit-sensitive products like furniture, eyewear, and custom items, where AR can cut returns and improve conversion.
Focus first on merchants that are already showing growth signals, like high traffic or recent tech stack investments. Start with one high-impact placement on a product page to prove ROI, then expand from there.
How do I know if a merchant is ready for OpenCart AR?
Look for merchants that have the budget, team bandwidth, and clear need to make AR a smart bet. With StoreCensus, focus first on stores doing $500,000 to $10,000,000 in annual revenue.
A few signs tend to stand out: active growth, a mature tech stack that still doesn’t include AR, AOVs of $75–$100+, and recent theme or catalog updates that show the brand is putting money into customer experience.
What should an OpenCart AR pilot include?
Focus on high-impact, fit-sensitive items that make the spend worth it, and place clear, easy-to-spot AR triggers on product pages.
Also trim GLB and USDZ files to keep them under 5 MB so they load faster on mobile. Then test device compatibility and track conversion results to show ROI.