Shopify Analytics: Key Metrics To Track
Covering 10 Shopify metrics to monitor—sales, net sales, AOV, conversion rate, returning customers, traffic sources, cart abandonment, refunds, and channels.

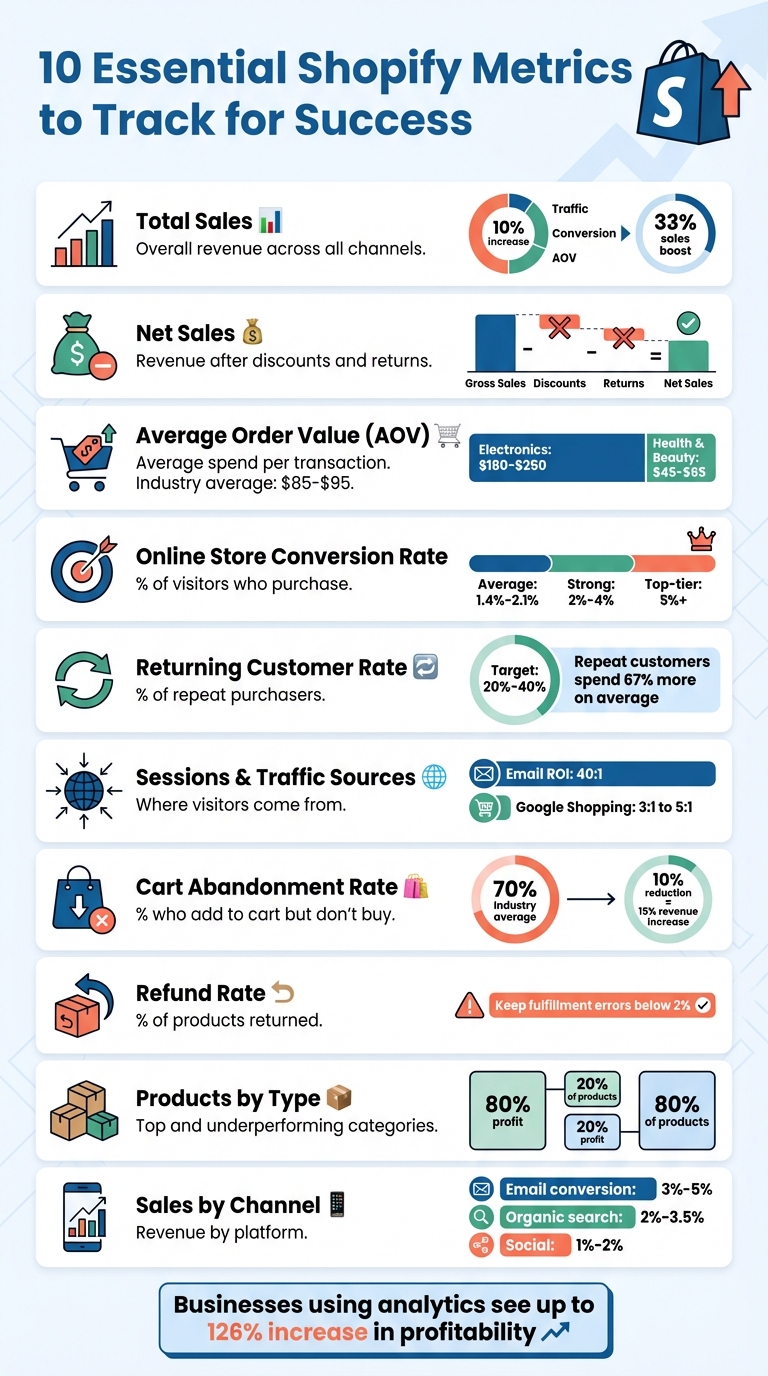
Running a Shopify store without tracking analytics is like driving blindfolded. The right metrics reveal how your business is performing and where to improve. Here are the 10 most important Shopify metrics every store owner should monitor:
- Total Sales: Tracks your store's overall revenue. Analyze trends to identify successful strategies or areas needing adjustment.
- Net Sales: Reflects revenue after discounts and returns. A gap between gross and net sales can indicate operational issues.
- Average Order Value (AOV): Shows how much customers spend per transaction. Boost AOV with strategies like free shipping thresholds or product bundles.
- Online Store Conversion Rate: Measures the percentage of visitors who make a purchase. Small improvements here can significantly increase revenue.
- Returning Customer Rate: Indicates customer loyalty. Repeat buyers spend 67% more on average than first-time customers.
- Sessions and Traffic Sources: Tracks where your visitors come from. Focus on channels that drive high-intent traffic.
- Cart Abandonment Rate: Highlights revenue lost due to incomplete purchases. Address issues like unexpected costs or complex checkouts.
- Refund Rate: Tracks returns and exchanges. High rates may signal product quality or description issues.
- Products by Type: Identifies top-performing and underperforming product categories. Use this data to focus marketing efforts and improve inventory management.
- Sales by Channel: Reveals which platforms generate the most revenue. Allocate resources to the most profitable channels.
Key takeaway: Businesses that use analytics see up to a 126% increase in profitability. Start tracking these metrics today to make informed decisions, improve performance, and drive growth.
10 Essential Shopify Metrics Every Store Owner Should Track
What Metrics Matter In The Shopify Analytics Dashboard

1. Total Sales
Total Sales represents the total revenue your Shopify store generates, encompassing various payment statuses (like paid, pending, and refunded), sales channels (such as your online store, POS, and social media), and specific time periods. It's a comprehensive snapshot of how much money your store is bringing in.
How This Metric Reflects Profitability and Sales Performance
Total Sales is a key measure of your store's financial health. If revenue is climbing, it often signals that your product launches or marketing strategies are hitting the mark. On the flip side, a dip in sales might mean it's time to rethink your approach. Traffic, conversion rates, and average order value (AOV) are the driving forces behind this metric. Even a modest 10% increase in each of these factors can result in a 33% boost in overall sales.
Take this example: A fashion brand in Mumbai discovered that while mobile users made up 78% of their site traffic, mobile conversion rates were only a third of what they were on desktop. By enhancing their mobile shopping experience, they managed to increase monthly revenue by approximately $18,000.
How to Use This Data to Improve Your Store
Tracking trends over time is crucial. Use Shopify's Compare feature to evaluate sales against previous periods, factoring in seasonal variations. For instance, you might notice that weekends or specific events, like a Monday newsletter, cause noticeable sales spikes. Understanding these patterns can help you fine-tune your strategy.
Break down sales by channel to determine which platforms - Google, Instagram, email campaigns - are delivering the best results. Then, reallocate your budget to maximize returns. Also, keep an eye out for products that are high-margin but underperforming in sales. These are often items with strong conversion rates but low visibility. Highlighting these products on your site or increasing ad spend for them could unlock more revenue. Historical data can also help you identify slower seasons, enabling you to plan promotions or adjust inventory levels accordingly.
2. Net Sales
Net Sales represents your actual revenue after accounting for discounts and returns. The formula is straightforward: Net Sales = Gross Sales - Discounts - Returns. Unlike Total Sales, which includes shipping fees and taxes, Net Sales focuses exclusively on the income generated from your products.
How This Metric Reflects Profitability and Sales Performance
Net Sales is crucial for understanding the real revenue your business has to cover costs and generate profit. For example, imagine a store reports $100,000 in gross sales. If $20,000 comes from steep discounts and $15,000 is attributed to returns, the actual net sales would drop to $65,000. That $65,000 is the amount you can truly rely on to measure profitability.
A significant gap between gross and net sales can highlight operational challenges. High return rates - often around 20%-30% - might point to issues like poor product quality, inaccurate descriptions, or unmet customer expectations. Similarly, if promotions boost gross sales but fail to improve net sales, it could mean your discounting strategy is cutting too deeply into profits.
Putting Net Sales Data to Work
To optimize your store, compare net sales across different sales channels. If one channel has higher return rates, it might be worth reconsidering your marketing spend there. Analyzing net sales by product can also reveal which items generate strong revenue with minimal returns. These products could be given more visibility, such as featuring them on your homepage.
Keep an eye on discount code performance to identify promotions that drive sustainable growth. Tools like Shopify's Compare feature can help you analyze net sales year-over-year, offering a clearer picture of growth trends by accounting for seasonal fluctuations. Research shows that businesses leveraging metrics like net sales for decision-making can see profitability increases of up to 23%. With this level of insight, you can fine-tune your strategies for both channels and products to maximize revenue.
3. Average Order Value (AOV)
Average Order Value (AOV) measures how much customers spend per transaction. To calculate it, divide your total revenue by the number of orders. For example, if your store generates $10,000 in revenue from 200 orders, your AOV would be $50. Alongside traffic and conversion rates, AOV is a key driver of revenue since it determines how much you earn per transaction.
How This Metric Supports Ecommerce Growth
AOV is just as critical as total and net sales when it comes to understanding your store's performance. What makes AOV particularly appealing is that increasing it is often cheaper than acquiring new customers. Why? Marketing costs stay the same, but your revenue per transaction grows. Here's a quick example: If you spend $30 to acquire a customer who makes a $50 purchase, your margin is $20. But if you can increase their AOV to $70, your margin doubles to $40 without needing to bring in additional traffic.
Shopify data shows that the average AOV for stores is between $85 and $95, though this varies by industry. Electronics stores often see higher AOVs, ranging from $180 to $250, while health and beauty brands typically fall between $45 and $65. Knowing your store's AOV can help you set realistic sales goals. For instance, if your AOV is $45, you'll need 222 customers to reach a $10,000 monthly revenue target. These insights provide a foundation for actionable strategies to grow your AOV.
How to Use This Data for Store Optimization
Boosting AOV is a smart way to improve your store's profitability. One effective tactic is to set a free shipping threshold that's 30% to 40% higher than your current AOV. For instance, if your AOV is $60, offer free shipping on orders over $85. This strategy works because 52% of shoppers are willing to add more items to their cart just to qualify for free shipping. Plus, orders that qualify for free shipping tend to be 30% higher in value.
Another proven method is product bundling. For example, in 2025, the home and kitchen brand Avera increased their AOV by 12% by introducing dynamic product bundles on their Shopify store. Similarly, the Swiss startup feey used a tiered progress bar to gamify the shopping experience, encouraging customers to spend more to unlock free gifts. This approach boosted their AOV by over 20%.
It's also worth analyzing how traffic sources impact AOV. Orders from search engine traffic, for instance, often have higher values compared to those from social media. By tracking AOV by channel, you can identify which marketing efforts bring in the most valuable customers - not just the most visitors.
4. Online Store Conversion Rate
The online store conversion rate shows the percentage of visitors who make a purchase. To calculate it, divide the total number of orders by the total sessions, then multiply by 100. For instance, if 1,000 people visit your store and 20 of them buy something, your conversion rate is 2%. This metric is powerful because it amplifies the return on your marketing efforts. Doubling your conversion rate from 1% to 2% means doubling your revenue without spending more on ads. It’s a window into how customers behave during their shopping journey.
How This Metric Reflects Profitability and Sales Performance
Conversion rates are a reliable way to gauge the overall health of your e-commerce business. They reveal how smoothly customers move from landing on your site to completing their purchase. Across a list of Shopify stores, the average store converts between 1.4% and 2.1%. A strong store often achieves rates between 2% and 4%, while top-tier stores can hit 5% or more [2,3,8]. However, these numbers vary by industry. For example, health and beauty stores commonly see 2.5% to 3.5% conversion rates, while electronics stores may struggle to exceed 1.2%.
Shopify offers detailed insights into the conversion funnel, highlighting drop-off points between stages like "Added to cart", "Reached checkout", and "Sessions converted". Tackling these drop-offs is key to boosting overall sales. For example, if you notice a sudden decline in conversions, it could signal technical issues like broken checkout buttons, slow-loading pages, or payment gateway errors.
Using This Data to Improve Your Store
Each stage of the funnel tells a story. A high drop-off rate between adding items to the cart and reaching checkout often signals friction points. Common reasons include unexpected shipping costs (which cause 48% of cart abandonments), requiring account creation (24%), and overly complex checkout processes (18%). Solutions like enabling guest checkout and simplifying forms can address these problems.
Page speed is another critical factor. A 1-second delay in load time can reduce conversions by 7%, while shaving 0.1 seconds off load time can improve conversions by 8.4%. Offering faster checkout options, like Shop Pay, can also boost conversion rates by an average of 1.3x. Additionally, upgrading product pages with at least five high-quality images - especially lifestyle photos - can increase conversions by up to 40% compared to plain white-background images.
Device and traffic source data provide further insights. Desktop users typically convert at about 1.9%, while mobile users hover around 1.0%. Email traffic often outperforms other sources, converting at 3-5% [10,3]. If mobile conversions lag, consider mobile-friendly updates like larger buttons (at least 56 pixels) and one-click payment options. These adjustments can help fine-tune your store’s performance and drive better results.
5. Returning Customer Rate
The returning customer rate shows the percentage of customers who come back to make a second purchase or more. This metric is a clear indicator of whether your store is building customer loyalty or relying heavily on attracting new buyers. For most ecommerce stores, a solid returning customer rate typically ranges between 20% and 40%. Stores selling consumable goods like coffee or supplements often achieve rates of 40–60%, while electronics retailers often struggle to surpass 10–20%. Understanding this metric is essential for refining customer retention strategies.
How This Metric Supports Ecommerce Growth
Retaining customers costs significantly less than acquiring new ones - 5 to 25 times less, to be exact. This makes a high returning customer rate a valuable growth driver. Plus, repeat customers tend to spend 67% more on average than first-time buyers, which helps increase profit margins with every additional purchase.
How This Metric Measures Profitability and Sales Performance
While metrics like conversion rates and average order value (AOV) reflect immediate performance, the returning customer rate highlights long-term customer satisfaction and product-market fit. A rate below 20% often points to issues like poor product quality, shipping problems, or a lackluster post-purchase experience. On the other hand, luxury brands often enjoy rates above 50%, showcasing how premium experiences and strong brand loyalty drive repeat business. For example, increasing your repeat purchase rate from 25% to 35% can significantly enhance your store's Customer Lifetime Value (CLV), allowing you to invest more confidently in customer acquisition while staying profitable.
How to Use This Data for Store Optimization
Breaking down your returning customer rate by acquisition source can reveal which marketing channels foster the most loyalty. Post-purchase email flows are a particularly effective tool, generating up to 30 times more revenue per recipient compared to traditional one-off campaigns. Automated sequences that include thank-you messages, product usage tips, and reorder reminders help keep your brand in customers’ minds effortlessly. For consumable goods, "Subscribe & Save" options can increase repeat purchase rates by 40–60%, converting one-time buyers into consistent revenue streams. Loyalty programs with tiered benefits and points-based rewards also provide strong incentives for customers to return, further boosting retention.
6. Sessions and Traffic Sources
After focusing on sales and conversion metrics, diving into sessions and traffic sources adds another layer to understanding your store's performance.
Sessions track the number of visits to your site, while traffic sources pinpoint where those visitors are coming from - whether it’s organic search, paid social campaigns, email marketing, or direct visits. It's worth noting that not all channels perform equally; for example, email campaigns and organic search often differ significantly in their ability to drive conversions.
How This Metric Supports Ecommerce Growth
Knowing which channels bring in the most revenue helps you focus your efforts where they matter. Imagine this: 200 high-intent visitors generating sales can be far more impactful than 1,000 visitors who barely convert. Just as conversion rates guide checkout improvements, analyzing traffic sources helps you fine-tune your marketing spend. By looking at "Sales by traffic source", you can pinpoint which channels actually drive purchases - not just clicks.
How This Metric Measures Profitability and Sales Performance
Traffic source data doesn’t just measure visitor volume; it highlights visitor quality. For instance, email marketing boasts an average ROI of 40:1, while Google Shopping campaigns typically deliver between 3:1 and 5:1. However, attribution can complicate things. Shopify's last-click attribution model tends to overemphasize "Direct" or "Search" traffic, often overlooking the original discovery channels. Even more misleading, up to 40% of Shopify traffic is misattributed as "Direct" when it actually stems from Instagram, TikTok, email campaigns, or messaging apps.
"Up to 40% of Shopify traffic shows as 'Direct' when it actually came from Instagram, email, messaging apps, or paid ads." - David Karpik, Founder, Clickport
How to Use This Data for Store Optimization
To get accurate traffic attribution, use UTM parameters consistently across email and social campaigns. Dive into your traffic source data to distinguish high-intent shoppers from casual browsers. If mobile traffic is high but conversions lag, it’s a sign you may need to address mobile checkout issues. Make it a habit to review sessions and traffic sources weekly to catch trends early. Also, don’t forget to filter out bot traffic - 51% of all web traffic in 2024 was automated, which can skew your session numbers and lower your conversion rates artificially.
These insights form the foundation for benchmarking your store’s performance using tools like StoreCensus.
7. Cart Abandonment Rate
Cart abandonment rate measures the percentage of shoppers who add items to their cart but leave without completing their purchase. With an industry-wide average abandonment rate of around 70%, this metric highlights how much potential revenue is lost at the final step of the sales process.
How This Metric Supports Ecommerce Growth
Cart abandonment is a powerful indicator of checkout issues. Shoppers who abandon their carts have already shown strong purchase intent, making them more valuable than casual visitors. Addressing this metric can yield significant results - a 10% drop in cart abandonment can boost revenue by 15%, all without the need to attract additional traffic. As Luis Gomez from Ecommerce Optimization aptly states, "Fixing the biggest leak almost always yields the biggest lift".
How This Metric Measures Profitability and Sales Performance
If abandonment rates hit 95% or higher, it often points to major technical issues like broken payment systems or checkout errors that need immediate resolution. Tackling these problems ensures smoother transactions and prevents revenue loss.
How to Use This Data for Store Optimization
To lower cart abandonment rates, focus on removing obstacles during checkout. Here are some strategies:
- Show costs upfront: Display shipping fees and taxes early to avoid surprising customers.
- Simplify checkout: Offer guest checkout and reduce the number of form fields.
- Recover lost sales: Use automated abandoned cart emails, sending reminders at 1, 24, and 48 hours to recover 10–15% of lost revenue.
- Build trust: Include trust badges and security signals to reassure the 13% of shoppers concerned about payment safety.
- Optimize for mobile: Since mobile users abandon carts at higher rates, ensure your checkout process is responsive and fast-loading. Even a 1-second delay can reduce conversions by up to 7%.
8. Refund Rate
Monitoring your refund rate is just as important as tracking conversion rates or cart abandonment when it comes to understanding product performance and overall profitability. This metric represents the percentage of products returned or exchanged after purchase. For example, if you sell 1,000 units in a month and receive 100 returns, your refund rate is 10%. Every return chips away at net sales and adds to shipping costs.
How This Metric Reflects Profitability and Sales Performance
A high refund rate can highlight deeper problems. Even a product with strong sales might fail to be profitable if 15% of orders come back as returns. By analyzing returns on a per-product basis, you can identify items that may look successful in terms of volume but are actually dragging down profits. Keeping your fulfillment error rate below 2% is critical - anything above this could signal operational inefficiencies that hurt your bottom line.
How This Metric Drives Ecommerce Growth
Refund rate insights go beyond identifying quality issues - they also point to ways you can enhance customer lifetime value. Lowering refunds not only improves margins but also strengthens customer relationships by reducing friction. Tracking returns daily can help you catch and address product or shipping issues before they snowball.
How to Use This Data for Store Optimization
Start by analyzing return rates for individual products. This can help you identify items that may need to be improved or even discontinued. Updating product descriptions and adding high-quality images can also bridge the gap between customer expectations and reality. For apparel stores, fine-tuning sizing charts based on customer feedback can significantly cut down on fit-related returns. If you notice an unexpected spike in returns, it’s worth investigating your shipping carriers and fulfillment processes - delays or incorrect shipments are often to blame for preventable returns.
Effect on Customer Experience and Retention
Frequent returns can erode customer trust, making returns feel like a normal part of shopping with your store. If your fulfillment error rate exceeds 2%, it's time for a thorough review of your processes to find where things are going wrong. Additionally, using return feedback to refine product pages can help reduce "not as described" returns - these not only frustrate customers but also tie up inventory during transit.
9. Products by Type
Tracking sales by product type gives you a clear picture of which categories are boosting your business and which ones might need extra attention. This metric helps identify the products that drive revenue and those that lag behind. Sorting data by revenue shows which categories are fueling financial growth, while sorting by units sold highlights high-volume items that might benefit from bundling or price tweaks. From there, you can dig deeper into how each product type contributes to overall profitability.
How This Metric Measures Profitability and Sales Performance
The 80/20 rule often applies here: around 80% of your profit usually comes from just 20% of your products. By analyzing sales by product type, you can pinpoint which categories deserve more investment and which ones might be draining resources. Even high-volume products can hurt your bottom line if they come with high return rates or slim margins. Tools like Shopify's "Smart Collections" can simplify this process by automatically organizing products by type or tag as you add new SKUs, keeping your reports accurate and saving you time.
"Products are signals. The winners show you what to scale. The laggards show you what to fix." - Luis Gomez, Ecommerce Optimization Expert
How This Metric Supports Ecommerce Growth
This data helps you decide where to focus your marketing efforts. Highlight your top-performing product categories on your homepage and in retargeting campaigns to reach audiences with similar interests. Digging deeper into sales by variant SKU - like specific colors or sizes - offers detailed insights into customer preferences, helping you fine-tune inventory and pricing strategies.
How to Use This Data for Store Optimization
Your "Top products by units sold" report is a valuable tool for managing inventory and avoiding stockouts on high-demand items. For categories with high traffic but few sales, investigate possible issues like pricing, product descriptions, or checkout friction. Bundling low-revenue, high-volume products with bestsellers can also help boost your average order value. If a specific product type has a higher-than-average return rate, it’s worth examining whether the problem lies in quality control or unclear product descriptions.
| Product Performance Category | Metric Signal | Recommended Action |
|---|---|---|
| Winners | High Revenue / High Volume | Feature on homepage; increase ad spend |
| Underperformers | High Traffic / Low Conversion | Audit imagery, reviews, pricing; check for friction |
| Volume Drivers | High Volume / Low Revenue | Use bundling or upselling to boost AOV |
| Problematic Items | High Revenue / High Return Rate | Investigate quality or product expectations |
Effect on Customer Experience and Retention
Knowing which product types generate the most customer service inquiries can help you improve product details upfront. Better images, detailed specs, and accurate sizing charts reduce confusion and make shopping easier. Monitoring sales velocity by product type ensures that popular items stay in stock, preventing frustration for loyal customers. Promoting top-selling products to first-time buyers can increase the chances of a second purchase, boosting your returning customer rate. By addressing customer concerns through improved product information, you not only enhance the shopping experience but also strengthen key performance metrics.
10. Sales by Channel
Understanding what products sell is essential, but knowing where those sales come from is equally important. Tracking sales by channel sheds light on your revenue sources, enabling smarter marketing budget decisions. This data helps pinpoint which platforms are driving the most value. For instance, email subscribers and organic search visitors typically convert at rates of 3–5% and 2–3.5%, respectively. In contrast, organic social media traffic tends to have lower conversion rates, around 1–2%, as users are often browsing rather than purchasing.
By analyzing sales by channel, you can connect the dots between traffic sources, customer behavior, and revenue generation.
How This Metric Supports Ecommerce Growth
Knowing which channels perform best allows you to allocate resources more effectively. For example, if paid search campaigns consistently outperform social advertising in terms of returns, shifting your budget to paid search could yield better results. However, keep in mind that Shopify's default last-click attribution model might undervalue early-stage channels. As much as 40% of traffic can end up categorized as "Direct" due to stripped tracking data, leading to potential misattribution.
"Instead of measuring return on ad spend, we started measuring return on profitability." - Brad Charron, CEO, Aloha
How to Use This Data for Store Optimization
To optimize your store, ensure no single channel accounts for more than 40% of your total traffic. Use UTM parameters on all links to prevent losing social and email traffic data to the "Direct" category. Additionally, calculate Revenue Per Visitor (RPV) to identify which channels bring in the most valuable customers. Since social media traffic is predominantly mobile, ensuring a seamless mobile checkout experience can help capture more sales. Focus on channels where the Customer Acquisition Cost (CAC) is less than 30% of the Customer Lifetime Value (CLV).
How This Metric Measures Profitability and Sales Performance
Email marketing remains a highly effective channel, often delivering a return of $40 for every $1 spent, with conversion rates between 3–5%. Direct traffic and organic search typically convert 2–3 times better than social media, making SEO and retargeting efforts more cost-effective than pouring additional funds into new social ads. For a clearer picture, focus on Net Sales per channel, which accounts for returns and discounts. Some channels may generate a lot of traffic but result in lower-quality sales, with higher return rates that can cut into profit margins.
Using StoreCensus for Shopify Metrics Benchmarking
StoreCensus does more than just track Shopify performance metrics - it helps you see how your store stacks up against others in your market. By analyzing data from over 2.5 million ecommerce stores, the platform lets you assess whether metrics like conversion rate, average order value (AOV), and cart abandonment rate are competitive within your niche.
One of its standout features is how it groups stores by traffic tiers. For instance:
- Stores with 10,000–50,000 monthly visitors typically install 3.0 apps, use 5.7 advertising pixels, and generate $50,000–$250,000 in monthly revenue.
- Mid-tier stores, with 50,000–200,000 monthly visitors, average 3.8 apps, use 6.0 ad pixels, and bring in $250,000–$1 million per month.
This segmentation provides a clear way to benchmark your store against others with similar traffic levels.
StoreCensus also offers real-time updates on changes within your niche. Whether a competitor adds a new app, updates their website design, or modifies their tech stack, you’ll know about it. These updates help you spot trends early, giving you the chance to adjust your strategy before falling behind.
Another useful feature is the ability to filter stores by new app installations. This lets you see which tools are driving growth and which combinations of apps are linked to better performance. It’s a goldmine for identifying tools that could give your store a boost.
Lastly, the platform’s advanced segmentation allows you to compare your metrics with stores that use similar apps. This helps you set realistic, data-driven goals and align your strategy with the best-performing Shopify stores in your category.
Conclusion
Using Shopify analytics allows you to move from relying on instincts to making informed, data-backed decisions for growing your store. By diving into the metrics mentioned earlier, you can adjust and refine every part of your Shopify business.
For instance, low conversion rates paired with high traffic might highlight issues in your checkout process, while a high cart abandonment rate could point to unexpected shipping costs. Understanding what your data reveals helps you tackle these problems before they start eating into your profits. In fact, businesses that track customer behavior through analytics experience a 126% increase in profitability compared to those that don’t.
Even small changes can lead to big results. Retaining just 5% more customers can increase profits by 25% to 95%. This proves that customer loyalty is just as critical as bringing in new buyers.
FAQs
What are the first 3 Shopify metrics to track?
The top three Shopify metrics to keep an eye on are conversion rate, total sales (or net sales), and average order value. These numbers offer a clear snapshot of your store's performance and profitability, making it easier to pinpoint opportunities for growth and fine-tune your strategy.
How can I tell if discounts and returns are hurting profits?
Analyzing profit reports that account for discounts and refunds is essential because these factors directly impact your profit margin. It's important to compare your revenue against associated costs to determine if discounts are eating into your profitability. For instance, are the discounts boosting sales enough to offset the reduced margins? Or are they simply cutting into your bottom line without adding much value?
Shopify's discount reports can be a useful tool here. They can help you assess whether your discounts are driving meaningful growth or if they’re just lowering your margins without significantly increasing net profit. This kind of insight is key to making smarter pricing and promotional decisions.
How can I fix wrong traffic attribution in Shopify?
To address traffic attribution issues in Shopify, start by implementing server-side tracking. This method helps overcome browser restrictions and ensures your data remains precise. Always use consistent UTM parameters across all your campaigns to clearly identify traffic sources.
Pay attention to potential blockers like cookie consent banners, which can interfere with tracking. Privacy-focused analytics tools can also be a reliable option for collecting data while respecting user privacy. Lastly, review your tracking setup thoroughly to fix misclassified sessions, such as those showing up as "Direct" or "Unassigned."