Shopify Store Traffic Benchmarks 2026
Traffic benchmarks for Shopify stores in 2026: visitor tiers, app and pixel usage, traffic sources, and gaps in email/reviews to guide scaling.


Most Shopify stores see fewer than 10,000 monthly visitors, while only 1.4% exceed 1 million. Traffic benchmarks in 2026 reveal clear patterns tied to store size, app usage, and revenue. Here’s a quick breakdown:
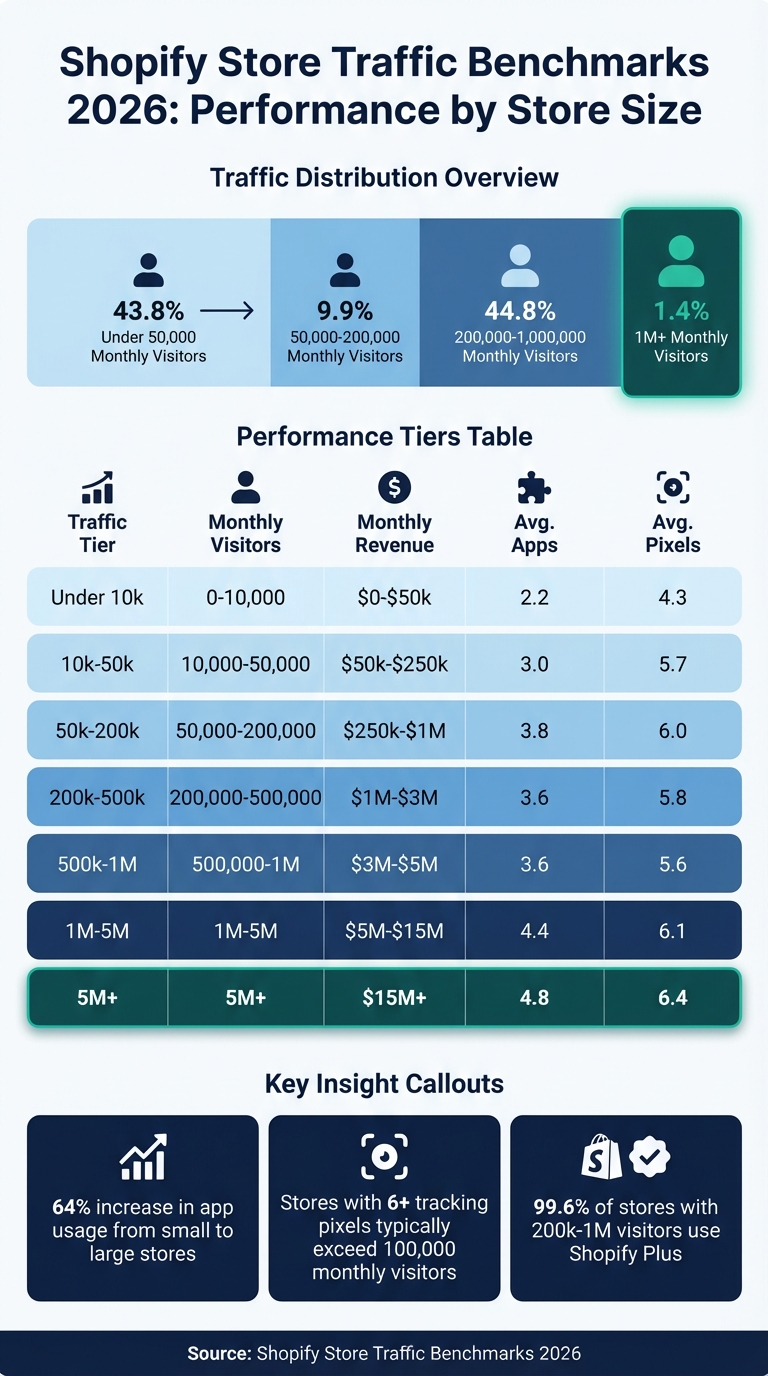
- Traffic Tiers: 43.8% of stores attract under 50,000 visitors monthly, while stores with 1M+ visitors use an average of 4.4 apps and 6.1 tracking pixels.
- Revenue Correlation: Stores with fewer than 10,000 visitors typically generate $0–$50K/month, while those with 1M+ visitors earn $5M+ monthly.
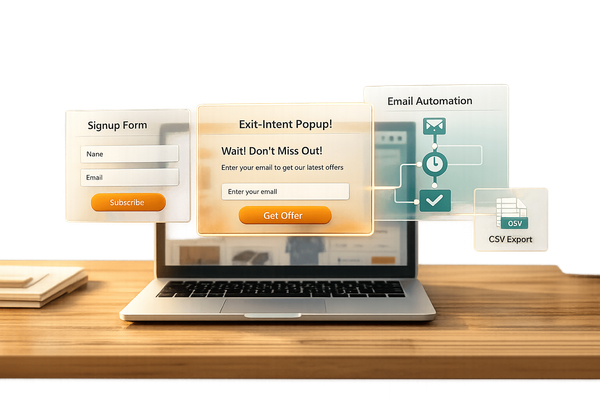
- Tech Gaps: 59% of stores lack email marketing apps, and 78% don’t use reviews apps - missed chances to boost engagement.
- Traffic Sources: Mobile accounts for 79% of visits. Organic search drives 20–30% of traffic for optimized stores, while paid ads dominate for mid-tier and large stores.
To scale, focus on tools like email marketing, reviews, and tracking pixels, while improving mobile performance and diversifying traffic sources.
Average Monthly Traffic Metrics
Shopify Store Traffic Benchmarks by Size: Revenue, Apps & Pixels in 2026
The typical Shopify store sees fewer than 10,000 visitors per month. Technology stores average about 2,900 visits monthly, followed by Sports & Outdoors at 2,800. Categories like Beauty & Personal Care, Healthcare, and Home & Garden each average around 2,500 visits, while Food & Beverage stores bring in roughly 2,000 visitors. Services businesses typically draw the least traffic, averaging just 1,000 visits per month.
When looking at traffic in relation to technical upgrades, stores with over 1 million monthly visitors tend to use an average of 4.4 apps and 6.1 tracking pixels. In contrast, stores with fewer than 10,000 visitors use only 2.2 apps and 4.3 pixels. This represents a 64% jump in app usage for high-traffic stores, highlighting a clear trend. Let’s dig deeper into traffic averages by store size to see how these patterns play out across different business tiers.
Traffic Averages by Store Size
Stores with fewer than 50,000 visitors per month make up 43.8% of Shopify’s platform. Those in the 50,000–200,000 range account for just 9.9%. Interestingly, stores in the 200,000–1,000,000 visitor tier represent 44.8%, though this group disproportionately includes Shopify Plus businesses. Only a small fraction - 1.4% - of stores achieve enterprise-level traffic exceeding 1 million visitors per month.
These tiers often correspond to revenue levels and team structures. For example, stores with fewer than 10,000 visitors typically generate between $0 and $50K in monthly revenue and are often run by founders. As traffic increases, so do revenue and team size. Stores in the 200,000–1,000,000 visitor range generally bring in $1–$5M in monthly revenue, with decision-making handled by department heads. At the top tier, stores with over 1 million visitors operate with corporate teams and generate $5M+ per month.
| Traffic Tier | Monthly Visitors | Typical Monthly Revenue | Avg. Apps Installed | Avg. Ad Pixels |
|---|---|---|---|---|
| Under 10k | 0 - 10,000 | $0 - $50k | 2.2 | 4.3 |
| 10k - 50k | 10,000 - 50,000 | $50k - $250k | 3.0 | 5.7 |
| 50k - 200k | 50,000 - 200,000 | $250k - $1M | 3.8 | 6.0 |
| 200k - 500k | 200,000 - 500,000 | $1M - $3M | 3.6 | 5.8 |
| 500k - 1M | 500,000 - 1M | $3M - $5M | 3.6 | 5.6 |
| 1M - 5M | 1M - 5M | $5M - $15M | 4.4 | 6.1 |
| 5M+ | 5M+ | $15M+ | 4.8 | 6.4 |
These metrics provide a clear framework for evaluating performance and setting realistic goals based on store size.
Standard Traffic Benchmarks
Using these tiers, you can establish clear performance benchmarks. For instance, the bottom half of Shopify stores receive fewer than 10,000 visitors monthly, serving as a median baseline. To break into the top 1.4% of stores, your traffic needs to exceed 1 million visitors per month.
One key tipping point occurs in the 200,000–1,000,000 visitor range, where Shopify Plus adoption soars to 99.6%. This is when businesses typically move from standard Shopify plans to enterprise-level solutions. At this stage, stores begin scaling their investments significantly - those in the 1–5 million visitor tier run twice as many apps and nearly double the tracking pixels compared to stores with fewer than 50,000 visitors.
For a practical gauge of competitor traffic, consider this: stores using six or more ad pixels generally attract at least 100,000 monthly visitors. Meanwhile, the 10,000–50,000 visitor range is often seen as a "sweet spot" for growth. Stores in this range usually have the resources to invest in scaling while still maintaining agility in decision-making.
Traffic Sources and Distribution
Knowing where your store's traffic comes from is crucial for measuring performance and planning growth. By analyzing traffic sources, merchants can better understand their competitive standing and refine their strategies.
Traffic Source Breakdown
In 2026, mobile devices account for 79% of Shopify visits, making mobile optimization a must-have for success. Organic search plays a major role, contributing 20% to 30% of total traffic for well-optimized stores. Smaller stores - those with fewer than 10,000 monthly visitors - tend to rely heavily on direct traffic and social media, as they often lack the infrastructure for advanced paid campaigns or email marketing. Interestingly, 70.3% of small stores in this category don't use any detectable email marketing app, compared to 51.3% of all stores in the same size range when broader segmentation is considered.
As stores grow into the 50,000–200,000 visitor range, paid advertising becomes a key traffic driver. Adoption of Meta Pixel increases from 56% in smaller stores to 86% in medium-sized ones. Similarly, Google Ads usage jumps from 39% to 73%. These medium-sized stores often run campaigns across multiple platforms, including Meta, Google, and TikTok.
For large stores with 1 million to 5 million monthly visitors, the strategy shifts toward diversification. These businesses balance their investments across paid channels while leveraging owned media, such as email and SMS, to encourage repeat visits. Notably, large stores are nearly twice as likely to use email marketing apps compared to stores with fewer than 50,000 visitors.
| Traffic Tier | Meta Pixel (Social) | Google Ads (Search) | TikTok Pixel | Avg. Tracking Pixels |
|---|---|---|---|---|
| Small (Under 10k) | 56% | 39% | 6% | 4.3 |
| Medium (50k–200k) | 86% | 73% | 14% | 6.0 |
| Large (1M–5M) | 81% | 72% | 10% | 6.1 |
This mix of traffic sources highlights the importance of balancing paid campaigns with organic growth strategies.
Paid vs. Organic Traffic Performance
Now, let’s dive into how paid and organic channels stack up. Stores using 6 or more tracking pixels often implement more diverse paid strategies, which helps them drive higher traffic volumes. However, scaling successfully requires combining paid acquisition with strong retention tools.
For example, email marketing can account for 30% to 40% of revenue in stores that use it effectively. Yet, 59% of Shopify stores still don’t have a detectable email marketing app. This is a missed opportunity, especially since stores using paid themes are 1.8 times more likely to adopt email marketing than those relying on free themes.
When it comes to social advertising, 22.5% of Shopify stores run Facebook ads. This suggests many merchants either focus on organic traffic or haven't expanded their paid efforts yet. Stores that invest in paid themes and apps often demonstrate greater marketing sophistication overall.
At the same time, rising costs for paid acquisition are encouraging stores to focus more on owned channels. Merchants in the 200,000–1,000,000 visitor range are turning to strategies like cart customization, loyalty programs, and email automation to drive repeat purchases. While TikTok Pixel adoption is still low at 10.6%, it’s gradually gaining popularity among direct-to-consumer (DTC) brands exploring new ways to acquire customers.
Traffic Benchmarks by Industry
Building on the discussion of traffic sources, taking a closer look at industry-specific benchmarks helps highlight unique performance trends across a list of Shopify stores.
Traffic Comparison Across Industries
Traffic benchmarks can differ significantly depending on the product category. Technology stores lead the way with an average of 2,900 monthly visits, while Sports & Outdoors stores are close behind at 2,800 visits. Beauty & Personal Care, Health & Wellness, and Home & Garden stores hover around 2,500 visits per month, while Food & Beverage stores typically see about 2,000 visits.
The gap becomes even more pronounced when looking at top-performing stores. For instance, in the Home & Garden category, the leading stores (ranked 1-10) average an impressive 12.5 million monthly visits. Fashion & Apparel stores in this tier see 9.02 million sessions with a bounce rate of 26.79%, while Consumer Electronics stores achieve 9.05 million sessions but have a higher bounce rate of 37.87%. Health & Wellness stores, on the other hand, bring in roughly 2.45 million visits per month with a bounce rate of 37.11%. Here's a quick breakdown of these metrics:
| Industry | Avg. Monthly Visits | Avg. Order Value | Bounce Rate (Top Stores) |
|---|---|---|---|
| Technology | 2,900 | $185 | 37.87% (Electronics) |
| Sports & Outdoors | 2,800 | $89 | N/A |
| Beauty & Personal Care | 2,500 | $67 | N/A |
| Home & Garden | 2,500 | $118 | N/A |
| Fashion & Apparel | 2,300 | $92 | 26.79% |
| Food & Beverage | 2,000 | $54 | N/A |
Industries like fashion and electronics rely on high traffic volumes to offset lower conversion rates, while niche markets thrive with smaller but more targeted audiences. Across all major industries, search engines remain the leading traffic source, though direct visits often indicate strong brand recognition and loyalty. Understanding these differences can guide businesses in setting benchmarks and refining strategies in a competitive ecommerce environment.
Seasonal Traffic Patterns
Seasonality plays a key role in shaping traffic trends. Today, two major shopping peaks dominate the calendar: Black Friday-Cyber Monday (BFCM) in November and Prime Day in July. For example, in 2024, BFCM drove $11.5 billion in Gross Merchandise Volume on Shopify alone. Meanwhile, Prime Day 2025 sales in the US reached $23.8 billion, marking a 28% year-over-year increase.
Certain categories experience unique seasonal patterns. Consumables like food and beauty products benefit from repeat traffic and quick purchase decisions, while high-ticket items such as furniture or luxury goods often require multiple visits before a sale. Fashion stores typically see predictable spikes during the holidays, but Beauty & Personal Care stores maintain steadier traffic throughout the year due to subscription models and frequent replenishment purchases.
Engagement Metrics and Traffic Relationships
Evaluating engagement metrics sheds light on how effectively stores turn visits into meaningful interactions, complementing the traffic benchmarks discussed earlier.
Marketing Maturity and Engagement Investments
High traffic doesn’t always translate to high engagement. As stores grow, they tend to invest more in tools and strategies to keep visitors engaged. For example, marketing maturity, measured by a Lead Score (on a scale of 0–100), rises significantly as traffic scales - from 55 in stores with fewer than 50,000 visitors to 82 in the 1M–5M visitor range. This indicates that higher-traffic stores are actively enhancing their tech stacks to maintain engagement.
Two key factors - site performance and social proof - play a critical role in linking traffic to engagement. A 2-second increase in load time (from 1 to 3 seconds) can cause bounce rates to jump by 32%. On the other hand, 93% of shoppers rely on reviews before making a purchase, yet 78% of Shopify stores lack a reviews app. Smaller stores are particularly behind, with 76.4% of stores under 10,000 visitors missing a reviews app. Larger stores, however, close this gap more effectively, with 51.1% of stores in the 50,000–200,000 visitor tier using reviews apps.
| Traffic Tier | Avg Apps | Avg Pixels | Lead Score (0-100) |
|---|---|---|---|
| Under 50k | 1.5 | 3.4 | 55 |
| 50k - 200k | 2.2 | 5.3 | 71 |
| 200k - 1M | 2.0 | 5.6 | 81 |
| 1M - 5M | 2.9 | 5.6 | 82 |
Interestingly, stores with over 200,000 visitors often streamline their tools, focusing on fewer but more robust enterprise solutions rather than adding more apps. Paid themes also play a role in engagement strategies - stores using them are 1.8 times more likely to use email marketing and nearly twice as likely to implement reviews and loyalty programs compared to those using free themes. These trends offer valuable benchmarks for assessing competitors and refining growth strategies.
While marketing maturity enhances engagement, site speed remains a non-negotiable factor.
Bounce Rate Patterns
Bounce rates are heavily influenced by site speed and overall user experience. To keep visitors engaged, leading stores in 2026 focus on meeting Core Web Vitals standards. Specifically, they aim for a Largest Contentful Paint (LCP) under 2.5 seconds and an Interaction to Next Paint (INP) under 200 milliseconds. Falling short of these benchmarks risks losing engagement, as user expectations for speed and responsiveness continue to rise.
Higher-traffic stores also dedicate more resources to monitoring engagement, with Lead Scores often reflecting improvements in site performance. However, adding complexity comes with risks. Stores that regularly audit their tech stacks - removing unused apps and limiting font families to two - can prevent render-blocking issues and reduce bounce rates. The key is to strike a balance: each additional tool should enhance, not hinder, the overall user experience.
Traffic Growth from 2024 to 2026
Annual Growth Rates
Traffic for Shopify stores has been on a steady upward trajectory, thanks to a combination of new merchants joining the platform and established stores scaling their operations. By Q4 2025, Shopify's total store count had grown by 18% year-over-year, while revenue soared by 26%, reaching $8.88 billion in 2024. However, traffic growth varies depending on the type of store. Smaller stores with simpler tech setups see slower growth, whereas mid-tier stores are ramping up their advertising efforts, typically using around 6.0 tracking pixels on average. High-traffic stores, on the other hand, are shifting focus from just attracting new visitors to improving retention and fine-tuning conversions.
The performance of specific industries sheds light on where the opportunities lie. For instance, Beauty and Personal Care stores boast strong conversion rates of 6.8%, driven by repeat purchases and successful influencer campaigns on visually rich platforms. Consumer Electronics stores see spikes in traffic during major shopping events, such as Prime Day 2025, which led to a 28% increase in sales. Meanwhile, Fashion and Apparel stores - representing 28.2% of all Shopify stores - continue to lead the pack, leveraging high profit margins to fuel aggressive social media advertising strategies. These industry trends highlight how merchants are adapting their mobile and advertising strategies to stay competitive.
Trends Driving Traffic Growth
The rise in traffic has prompted merchants to rethink their strategies. Mobile-first traffic now accounts for 68% of all Shopify visits, with mobile commerce projected to make up 59% of all online retail sales by 2025. To keep up, merchants are optimizing mobile performance, aiming for a Largest Contentful Paint (LCP) under 2.5 seconds since every additional second could mean a 7% drop in conversions.
Paid advertising has also become a cornerstone for driving growth. TikTok, for instance, is gaining traction, with 13.9% of merchants using it overall and adoption peaking at 29.8% among stores with 5M–20M visitors. This reflects a broader trend toward multi-channel advertising strategies that include platforms like Meta, Google, TikTok, and Pinterest. Meta Pixel remains widely used, with a 70% adoption rate, while 69.6% of stores rely on Google Analytics 4 for better attribution insights.
A notable shift is the increasing focus on owned marketing channels. Email marketing, despite its impressive 4.29% conversion rate - the highest among all channels - is still underutilized, with 59% of Shopify stores lacking a dedicated email marketing app. Tools like Klaviyo (adopted by 25.8% of stores) and SMS marketing are gaining momentum as merchants aim to drive repeat traffic and cut down on paid acquisition costs. Stores implementing email marketing early, particularly before hitting 50,000 monthly visitors, consistently outperform those relying solely on paid ads. Additionally, retention tools like loyalty programs and subscription models are becoming essential for stabilizing traffic as advertising costs continue to climb. These strategies not only help merchants grow revenue but also offer valuable benchmarks for staying competitive in a crowded market.
Conclusion
Traffic benchmarks in 2026 highlight much more than just visitor numbers. Recent figures reveal that 43.8% of Shopify stores attract fewer than 50,000 monthly visitors, while only 1.4% surpass the 1 million mark. But visitor counts alone don’t tell the full story. The data emphasizes the importance of a store’s technological setup as a key performance metric. For instance, stores with over 1 million monthly visitors typically use 4.4 apps and 6.1 tracking pixels, compared to just 2.2 apps and 4.3 pixels for stores with less than 10,000 visitors.
There’s also a lot of untapped potential in addressing tech stack gaps. For example, 59% of stores lack a dedicated email marketing app, and 78% don’t use a reviews app. On top of that, successful stores diversify their traffic sources. 61.4% use Meta Pixel, and 13.9% leverage TikTok for tracking and advertising. Performance metrics like maintaining a Largest Contentful Paint (LCP) under 2.5 seconds are also critical for improving conversion rates.
For merchants and agencies looking to stay ahead, tools like StoreCensus provide real-time insights into the shifting dynamics of ecommerce. With data on app installations, tech stack changes, and growth signals across 2.5 million ecommerce stores, you can uncover which competitors are scaling, what tools they’re adopting, and when stores hit major traffic milestones. This kind of intelligence helps refine strategies, identify opportunities, and drive growth based on actionable insights - no more guesswork.
In 2026, the stores that thrive are the ones making informed decisions about their investments, traffic channels, and long-term growth strategies. Data-driven insights are no longer optional - they’re essential.
FAQs
What traffic tier is my Shopify store in?
To get a sense of your Shopify store's traffic tier, one useful indicator is the number of apps installed. For example, stores attracting over 1 million visitors per month tend to use an average of 4.4 apps, while stores with fewer than 10,000 monthly visitors typically use around 2.2 apps. You can also leverage tools like benchmarks or store analysis platforms to compare your store's performance and gain deeper insights.
How many visitors do I need to hit $100K/month?
To generate $100,000 in monthly revenue, you'll generally need between 50,000 and 70,000 visitors per month. This estimate is based on an average conversion rate of 1.4% to 1.8%, which aligns with typical performance metrics for Shopify stores.
Which apps should I add first to grow traffic?
To boost traffic to your Shopify store, prioritize apps that improve marketing, customer interaction, and conversions. Successful stores with over 1 million monthly visitors often rely on tools like Klaviyo and Yotpo for email marketing, customer reviews, and retention strategies. Adding apps for advertising and analytics - like tracking pixels - can fine-tune your campaigns and help target visitors more effectively. Take a look at your competitors' tech stacks to discover apps that could make a big difference for your store.