How Revenue Potential Impacts Lead Prioritization
Prioritize leads by revenue potential, not volume, to close bigger, faster deals and build a reliable high-value pipeline.


Revenue potential determines how likely a lead is to bring financial value, making it a key factor in prioritizing sales efforts. Instead of chasing every lead, focusing on high-revenue businesses can improve efficiency and results. These businesses often have larger budgets, faster decision-making processes, and a greater capacity for long-term partnerships. Here's what matters most:
- Revenue Tiers: Higher annual revenue often means faster decisions and better scalability.
- Key Metrics: Metrics like monthly traffic, average order value (AOV), and product catalog size signal financial strength and operational maturity.
- Growth Signals: Active ad campaigns, premium tech stacks, and hiring trends indicate readiness for investment.
- Lead Nurturing: Businesses excelling in lead nurturing generate 50% more sales-ready leads at 33% lower costs.
What Revenue Potential Means for Ecommerce Lead Prioritization
Defining Revenue Potential
Revenue potential refers to the estimated financial value a lead can bring, calculated using factors like current revenue, growth trends, and purchasing power. Essentially, it’s about ranking prospects based on how likely they are to buy and the potential value they can bring to your business.
Three key elements shape revenue potential: financial value (such as annual revenue and traffic volume), unit economics (metrics like Average Order Value, product margins, and repeat purchase rates), and growth stage (whether the business is scaling or just staying afloat).
A practical rule of thumb here is the "1% Rule." This suggests that a monthly agency retainer should be about 0.5–1% of a store’s annual revenue. For example, a store generating $1 million annually can reasonably afford a $5,000–$10,000 monthly retainer. On the other hand, a store making $500,000 annually likely cannot, no matter what they promise. This approach ensures you’re targeting leads that can sustain your services without financial strain.
Understanding revenue potential provides a clear framework for why prioritizing leads based on financial strength is far more effective than focusing solely on volume.
Why Revenue Potential Beats Lead Volume
When you compare revenue potential to lead volume, the advantages of focusing on financial value become obvious.
If leads aren’t prioritized, sales efforts can become scattered and inefficient. Sales teams have limited time and resources - if they’re handed 500 leads but can only manage 100, they risk wasting time on low-value prospects while high-value opportunities slip away. By emphasizing revenue potential, teams can zero in on leads that have the highest likelihood of converting and delivering long-term value.
High-revenue businesses operate differently from smaller, bootstrapped startups. These larger stores have seasoned operators who are familiar with metrics like customer acquisition cost (CAC) and lifetime value (LTV). They’re also able to make decisions quickly, often after a single call, instead of dragging out the process over weeks. This leads to shorter sales cycles, faster onboarding, and better client retention. In fact, companies that excel in lead nurturing generate 50% more sales-ready leads at 33% lower costs, and these nurtured leads tend to make 47% larger purchases.
The contrast between high-revenue and low-revenue leads is striking. High-revenue stores are typically in a growth phase, focused on optimization and strategic expansion. Meanwhile, lower-revenue stores are often just trying to survive, which can mean longer decision-making processes and a higher risk of churn. By focusing on revenue potential, you create a pipeline that consistently nurtures high-value leads, reducing the need to start prospecting from scratch each month.
Advanced Lead Scoring Techniques for B2B Tech Companies
Metrics That Measure Revenue Potential
High-Revenue vs Low-Revenue Lead Comparison Metrics
When assessing revenue potential, it's crucial to focus on specific metrics that reveal both the financial capacity and growth prospects of a store. These metrics can be categorized into direct revenue indicators and indirect revenue indicators.
Direct Revenue Indicators
Annual revenue is the most straightforward metric for determining whether a lead is worth pursuing. Higher revenue tiers typically indicate faster decision-making, larger budgets, and more sophisticated operations. Interestingly, revenue tier often outweighs industry type when evaluating lead quality.
Traffic volume serves as a strong indicator of sales capacity. Agencies often target stores with 10,000–50,000 monthly visitors, as this range suggests an established and growing brand. Stores with fewer than 5,000 monthly visitors are typically in the startup phase and have limited budgets, while those exceeding 200,000 visitors often come with the complexities of enterprise-level decision-making.
Average Order Value (AOV) highlights profit margins and marketing potential. Stores with an AOV of $100 or more tend to have better margins and a higher tolerance for Customer Acquisition Costs (CAC), enabling larger marketing budgets. Similarly, a product catalog size of 100–500 products often signals a mature operation with significant scale. Industry-specific benchmarks also play a role - sectors like supplements, skincare, and jewelry (with margins of 50–70%) present greater revenue opportunities compared to low-margin industries like electronics (30–40%).
Indirect Revenue Indicators
Beyond direct metrics, certain growth signals and technology changes can provide deeper insights into a store's revenue potential.
Active ad campaigns are a key indicator. For example, Facebook or TikTok campaigns with 20+ variations running for six months or more suggest profitability and robust marketing budgets. These campaigns demonstrate that the store has achieved product-market fit and is scaling effectively.
Technology stack upgrades offer another layer of insight. Stores migrating to Shopify Plus or adopting premium tools like Klaviyo, Triple Whale, or ReCharge signal a commitment to growth and a willingness to invest. On the other hand, stores relying on free apps and default Shopify themes like Dawn often lack the resources for premium services.
Hiring activity and funding announcements are forward-looking indicators. Stores posting job openings for marketing roles or announcing new funding rounds are gearing up for growth, making them prime candidates for outreach. Identifying these signals early can give you a competitive edge.
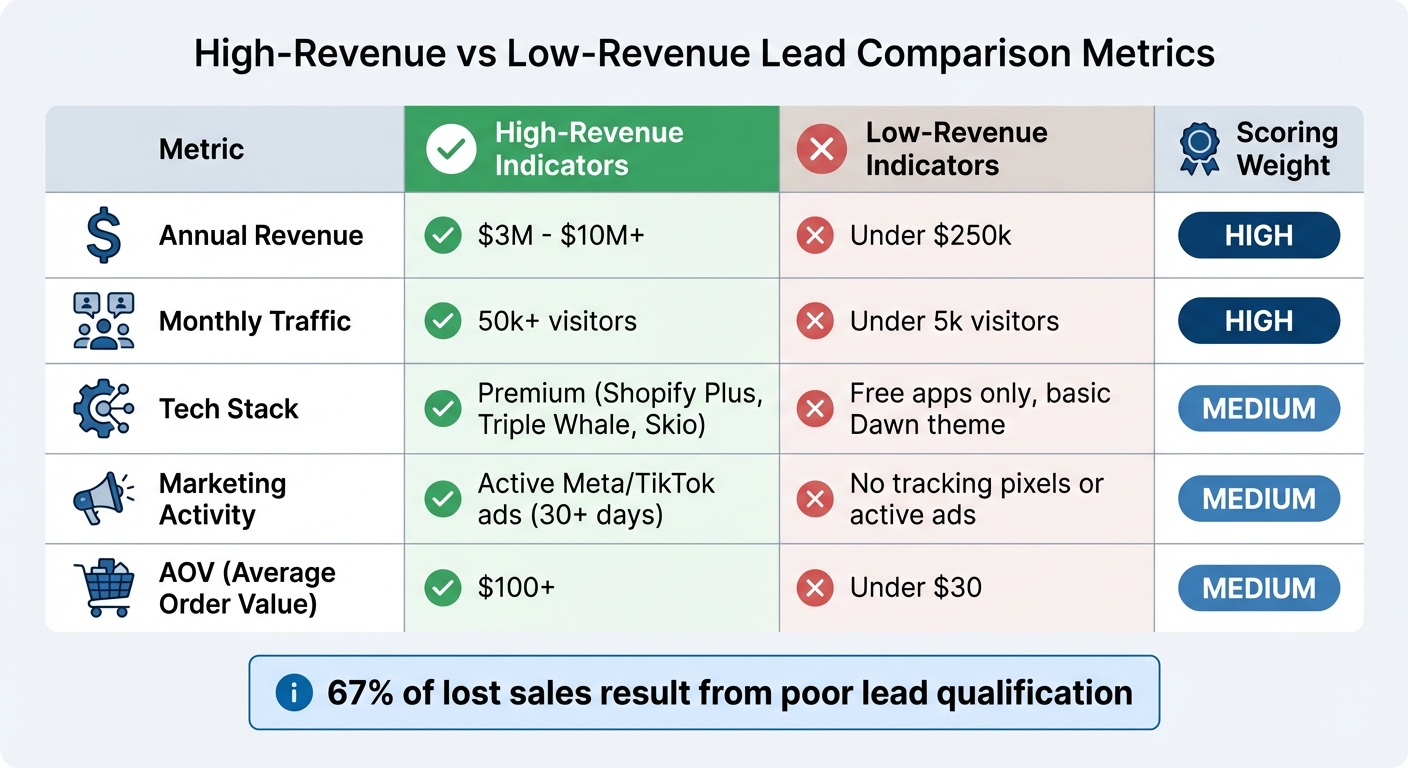
High-Revenue vs. Low-Revenue Lead Comparison
The table below highlights how these metrics differentiate high-revenue leads from low-revenue ones, along with their relative importance.
| Metric | High-Revenue Indicators | Low-Revenue Indicators | Scoring Weight |
|---|---|---|---|
| Annual Revenue | $3M - $10M+ | Under $250k | High |
| Monthly Traffic | 50k+ visitors | Under 5k visitors | High |
| Tech Stack | Premium (Shopify Plus, Triple Whale, Skio) | Free apps only, basic Dawn theme | Medium |
| Marketing Activity | Active Meta/TikTok ads (30+ days) | No tracking pixels or active ads | Medium |
| AOV | $100+ | Under $30 | Medium |
This breakdown underscores a critical point: 67% of lost sales result from poor lead qualification. High-revenue leads tend to act quickly and operate with greater sophistication, while low-revenue leads often face prolonged decision cycles. By focusing on metrics like annual revenue and traffic volume - both carrying the highest scoring weight - you can better predict and prioritize conversion success.
How StoreCensus Supports Revenue-Based Lead Prioritization
StoreCensus monitors over 2.5 million ecommerce stores, enriching each with more than 25 structured data points. This makes it easier to evaluate a store's revenue potential without the need for manual research. By combining revenue estimates for Shopify stores with insights like traffic trends, tech stack details, and activity signals, StoreCensus helps you focus on leads that are worth your time.
Using StoreCensus Data Points for Revenue Assessment
The platform’s data points offer a comprehensive snapshot of a store’s financial potential. You can filter stores by specific revenue ranges - such as $1M–$5M - and add extra layers of criteria, like traffic volume, installed apps, or marketing activity. This replaces guesswork with actionable insights.
StoreCensus also employs a 1-5 star rating system to evaluate leads. This system measures "Fit" (like revenue tier and industry) and "Intent" (based on recent activity signals) to guide your prioritization. As StoreCensus explains:
"The intelligence that made them a good prospect travels with them through your entire sales process".
The platform doesn’t stop at assessment - it also simplifies your workflow with automation.
Filtering and Automating by Revenue Signals
StoreCensus integrates seamlessly with your CRM, automatically updating records and triggering outreach when a store’s revenue bracket changes or when key tools like ReCharge are added to their tech stack.
You can set notifications to align with budget cycles, such as scheduling outreach early in the year when budgets are refreshed. This timing-based strategy can significantly boost results - some agencies using a compounding pipeline to re-engage leads have reported 233% to 300% higher revenue from the same prospecting efforts.
Additionally, enriched data can sync directly to platforms like Salesforce, HubSpot, and Apollo through Zapier or API connections. This allows you to automate lead scoring and focus on the revenue signals that align with your business goals.
Finding High-Growth Shopify Stores

Identifying the right growth opportunities is critical, and StoreCensus excels in this area. Its advanced filters help you zero in on Shopify stores that are outgrowing their current setup. The STAMP framework (Size, Tech, Activity, Multiple contacts, Pain) provides a structured way to prioritize leads. For example, you can target stores with 10,000–50,000 monthly visitors that lack essential growth tools like Klaviyo or subscription apps. This mismatch signals both capacity and a clear need.
StoreCensus also offers real-time monitoring to track app installs, product launches, and contract lock-ins as they happen. This allows you to time your outreach perfectly. For instance, if a high-traffic store installs one premium app but overlooks a complementary tool, you can quickly send personalized outreach that highlights the gap and the potential benefits of bridging it.
Mistakes to Avoid in Revenue-Based Lead Prioritization
Having access to revenue data is just the starting point. To truly convert high-potential leads, it’s crucial to avoid some common pitfalls that can derail your lead prioritization efforts.
Ignoring Growth Trends
Focusing only on current revenue figures while overlooking growth indicators can lead to missed opportunities. For instance, a business generating $2 million today with a 40% year-over-year growth rate could be a stronger long-term prospect than a stagnant $5 million business. Research shows that 60% of top prospects aren’t ready to buy for 3 to 12 months.
Let’s compare two businesses: one with $3 million in revenue, an average order value (AOV) of $150, and a 40% repeat purchase rate - clear signs of rapid growth. The other has a $35 AOV and a 5% repeat rate, suggesting instability. Without tracking additional signals, like hiring trends (e.g., a job posting for a "Growth Manager") or new app installations, you might misclassify these leads and miss out on promising opportunities.
Trusting Unverified Data
Leaning on self-reported or outdated data can steer your prioritization in the wrong direction. Agencies that estimate revenue based on product pricing or gut instincts often chase after prospects who can’t afford their services. This not only wastes time but also demotivates your team.
Manual processes for qualifying leads are another weak link. They’re limited to handling 20–50 leads daily and tend to be subjective and inconsistent. Automated data enrichment, on the other hand, delivers 85–95% accuracy, far surpassing the 60–75% accuracy of manual research. It also updates in real time, unlike static data, which decays at a rate of 2.1% per month. And don’t forget to verify contact emails - ensuring at least 70% deliverability can save your sender reputation from being damaged by bounces.
Using Single Data Points
Basing your prioritization solely on revenue tiers can create what’s been called "priority paralysis". When leads appear identical because they fall into the same revenue range, your sales team might spread their efforts too thin, treating all leads equally even though their actual conversion potential varies widely. This approach dilutes your focus and reduces close rates.
Conclusion
Driving revenue growth requires a smarter approach to lead prioritization. By shifting focus to revenue-based strategies, you can direct your sales efforts toward leads that are more likely to convert and contribute to long-term success. Prioritizing stores that match your pricing, budget, and key metrics (like CAC and LTV) ensures you’re building a pipeline of reliable, high-value partners.
Re-engaging high-revenue leads can amplify results, with potential revenue boosts of up to 233%. This strategy also helps avoid losing up to 70% of qualified leads - a critical factor when 60% of top prospects might take anywhere from 3 to 12 months to make a purchase decision.
StoreCensus simplifies this process by offering access to 25+ structured data points across 2.5 million ecommerce stores. You can filter by revenue tiers, identify tech stack gaps, and track real-time growth signals. Take Sarah’s example: between 2024 and 2025, she used StoreCensus to target Shopify beauty brands earning $1M–$5M annually that used ReCharge but hadn’t adopted Klaviyo. By honing in on these gaps, she converted 25% of qualified leads and scaled her agency to $84,000 MRR with 14 clients in just 12 months.
The platform’s 1–5 star rating system and status tracking features (e.g., Contacted, Replied, Negotiating) allow your team to focus 60% of their efforts on high-fit leads, achieving impressive close rates of 40–60%. Plus, real-time monitoring ensures you can act when intent is highest. For instance, sales reps who reach out within 5 minutes of lead engagement experience a 900% increase in conversions compared to those who wait 10 minutes.
With StoreCensus, data accuracy, advanced filtering, and automation come together to help your team close bigger deals with clients who have the budget and growth potential to sustain long-term partnerships. This targeted approach transforms sales from a numbers game into a high-impact, precision-driven strategy.
FAQs
How do I estimate a lead’s revenue potential?
To gauge a lead's potential revenue, focus on real-time data and metrics that highlight growth trends and buying intent. Tools like StoreCensus can evaluate leads by analyzing signals such as revenue increases, changes in their tech stack, and overall business activity. By combining fit factors (like company size) with intent indicators (such as hitting recent growth milestones), you can zero in on high-value leads. This approach helps boost both close rates and overall pipeline efficiency.
What’s the fastest way to score leads without manual research?
The quickest way to generate leads without spending hours on manual research is by turning to automated data enrichment tools. These tools provide real-time, structured store intelligence, making the process faster and more efficient. For instance, platforms like StoreCensus allow you to qualify leads effortlessly by updating key details such as revenue, tech stack, and contact information. You can also filter e-commerce stores, track updates, and automate outbound sales workflows - eliminating the delays and high costs associated with manual methods.
How should I prioritize leads with similar revenue?
When leads show similar revenue levels, it's smarter to shift your attention to growth signals, recent store activity, and intent indicators like app installations or changes in their tech stack. These clues can pinpoint high-potential prospects far more effectively than just looking at revenue figures.