How to Identify High-Growth Ecommerce Stores
Identify ecommerce stores poised for real growth by tracking revenue, traffic trends, repeat purchase rate, conversion and AOV — and using automation tools.


High-growth ecommerce stores excel by consistently increasing revenue, attracting more website traffic, and retaining loyal customers. These businesses demonstrate long-term potential through metrics like revenue growth rate, repeat purchase rate, and conversion rates. Spotting these stores early can help you find investment opportunities, build partnerships, or refine market strategies. Key insights include:
- Revenue Growth Rate: Tracks financial health and scalability. Look for steady growth above industry benchmarks (e.g., 7.5% global ecommerce growth in 2026).
- Website Traffic Trends: Rising visitors, low bounce rates, and a mix of new and returning users signal growth potential.
- Repeat Purchase Rate (RPR): Indicates customer loyalty and product-market fit. High RPR reduces dependency on acquiring new customers.
- Conversion Rate & Average Order Value (AOV): Efficient sales pipelines and higher spending per transaction reflect strong performance.
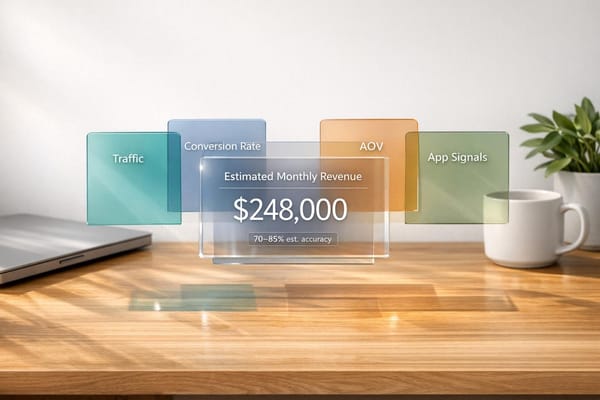
Tools like StoreCensus automate the process of tracking these metrics, enabling you to monitor traffic, tech stack changes, and growth signals across 2.5M+ stores. By combining data analysis with real-time updates, you can focus on stores with the greatest potential for sustained success.
Key Metrics to Scale E-Commerce to $1 Million a Month
Growth Indicators for Ecommerce Stores
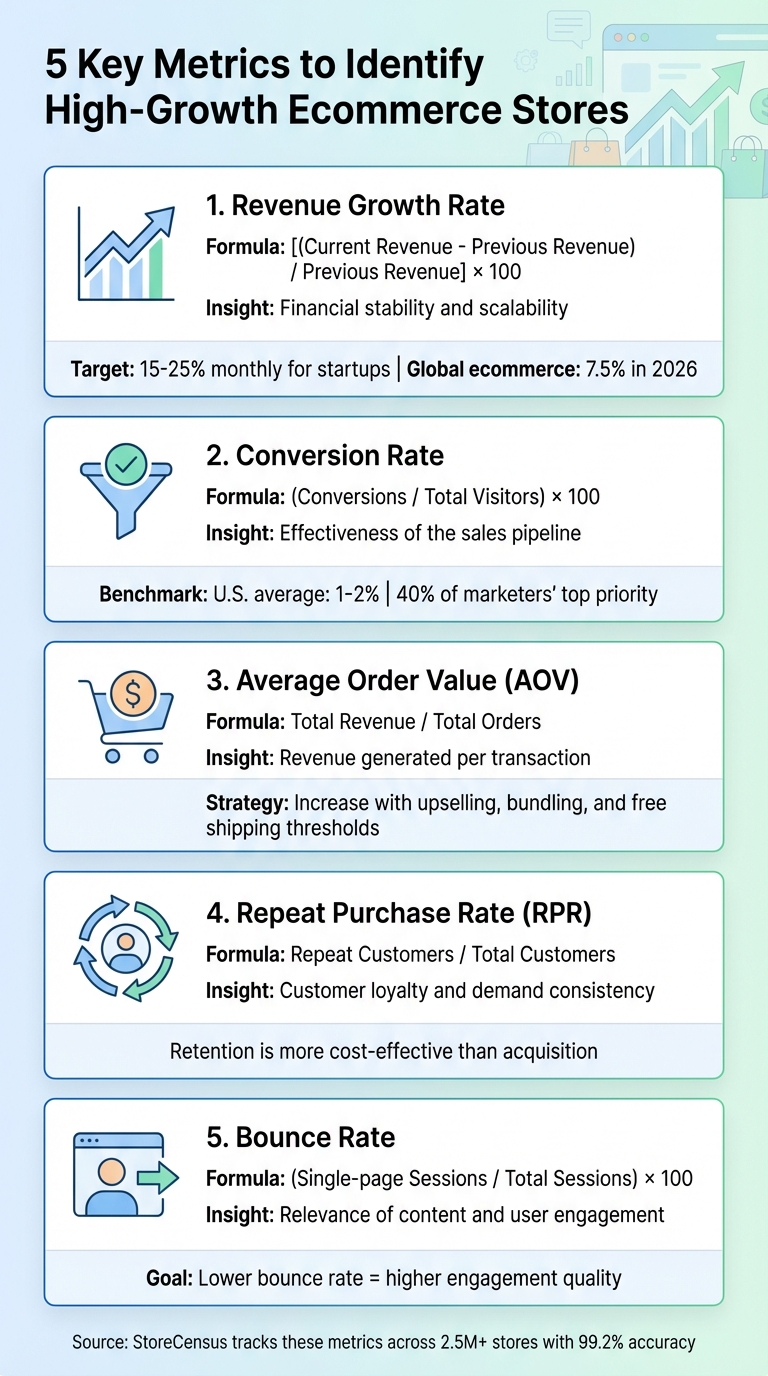
5 Key Metrics to Identify High-Growth Ecommerce Stores
Understanding what sets high-growth ecommerce stores apart requires diving into specific metrics that highlight sustainable growth rather than fleeting success. Let’s break down these key indicators and what they reveal about a store's long-term potential.
Revenue Growth Rate
The revenue growth rate tracks how much a store's total revenue changes over a given period - whether monthly, quarterly, or annually. This metric is a strong signal of financial stability and the ability to reinvest in areas like hiring, product development, and market expansion. For example, early-stage startups often aim for monthly revenue growth between 15–25%, while small SaaS companies may achieve over 50% year-over-year growth.
Consistency is what matters most. Stores that steadily grow their revenue quarter after quarter show that their business models can scale effectively. To get an accurate picture of growth, using the compound annual growth rate (CAGR) helps account for compounding effects over time. For context, global ecommerce growth is projected to hit 7.8% in 2025 and 7.5% in 2026. Stores outperforming these benchmarks are worth keeping an eye on, especially when planning lead generation or partnerships.
Website Traffic Trends
Website traffic offers an early glimpse into future sales, often before they show up in revenue reports. High-growth stores typically see increasing numbers of unique visitors and page views. However, it’s not just about volume - quality matters too. Metrics like low bounce rates and diverse traffic sources (organic search, direct visits, social media, and email) reflect strong brand appeal across multiple channels.
Another important aspect is the mix of new versus returning visitors. A healthy balance suggests that the store is excelling at both attracting new customers and retaining existing ones. Engagement metrics like time on site and add-to-cart rates also reveal the intent behind the traffic. For instance, the beauty brand Three Ships monitors page views on its blog-based gift guides as a way to predict holiday sales, allowing them to fine-tune their marketing strategies in real time. These traffic insights can highlight stores that are primed for revenue growth.
Repeat Purchase Rate
The Repeat Purchase Rate (RPR) measures how many customers come back after their initial purchase. This metric is vital because retaining customers is far more cost-effective than acquiring new ones. A high RPR indicates strong customer loyalty and a solid product-market fit, while a low RPR might point to issues with the product or overall customer experience. Stores with consistently high RPRs demonstrate that they’ve built trust and satisfaction, positioning themselves for steady growth.
Conversion Rate and Average Order Value
The conversion rate shows how efficiently a store turns visitors into buyers. In the U.S., most ecommerce sites have conversion rates between 1% and 2%, and nearly 40% of online marketers consider it the most important ecommerce metric to track. A higher-than-average conversion rate often reflects strengths in areas like product presentation, pricing, or the checkout process.
Average Order Value (AOV) measures the average spending per transaction and highlights opportunities for strategies like upselling or bundling. A higher AOV can help offset fixed costs, such as shipping and customer acquisition, by generating more revenue per order. For example, offering free shipping on orders over a certain amount - like $50 - can encourage customers to add more items to their carts, simultaneously increasing AOV and keeping conversion rates steady. Together, these metrics offer insights into sales efficiency and help refine marketing and upselling tactics.
| Metric | Formula | What It Reveals |
|---|---|---|
| Revenue Growth Rate | [(Current Revenue - Previous Revenue) / Previous Revenue] × 100 |
Financial stability and scalability |
| Conversion Rate | (Conversions / Total Visitors) × 100 |
Effectiveness of the sales pipeline |
| Average Order Value | Total Revenue / Total Orders |
Revenue generated per transaction |
| Repeat Purchase Rate | Repeat Customers / Total Customers |
Customer loyalty and demand consistency |
| Bounce Rate | (Single-page Sessions / Total Sessions) × 100 |
Relevance of content and user engagement |
Methods to Identify High-Growth Stores
Once you’ve pinpointed the metrics that matter, the next step is to dive into practical ways to spot growth signals in potential targets. This involves blending manual research with data analysis to uncover valuable insights.
Analyzing Public Traffic Data
Traffic data can reveal growth trends long before they show up in revenue reports. Tools like Semrush and Ahrefs are excellent for estimating monthly visits and tracking six-month traffic patterns of ecommerce sites. Stores on a growth trajectory typically show steady, upward trends rather than random spikes. Semrush, for instance, processes data from over 200 million users, offering a reliable snapshot of a store’s traffic.
It’s also important to analyze where traffic is coming from. A surge in referral or social traffic could indicate successful campaigns or partnerships. For example, a noticeable increase in social traffic might point to an effective influencer collaboration or a campaign that resonates with the audience. Metrics like Pages per Visit and Average Visit Duration can confirm whether this traffic reflects genuine interest. Pairing rising traffic with stronger engagement is a solid indicator of product-market fit.
Another emerging metric is AI traffic - tracking how often a brand is mentioned or recommended by AI tools like ChatGPT, Gemini, or Claude. As AI-powered assistants become a key part of online discovery, monitoring this visibility is becoming as important as traditional search rankings. SEO tools can also help you spot “Position Changes,” revealing which keywords a store is starting to rank for, potentially uncovering new market opportunities.
"AI assistants are becoming the gateway to online discovery, and understanding how tools like ChatGPT, Gemini, Claude, and Perplexity reference and recommend competitors is becoming just as critical as ranking in search engines." – Natalia Zhukova, Semrush
For large-scale analysis, batch tools allow you to evaluate traffic metrics for up to 200 domains at once. Additionally, comparing mobile and desktop traffic can provide insights into audience behavior. A stronger mobile presence often signals effective targeting of younger audiences or social-first shoppers. Once traffic trends are clear, it’s time to dig into social media signals to further gauge a store’s growth.
Reviewing Social Media and Digital Presence
Social media engagement often serves as an early indicator of future sales growth - even before it shows up in financial reports. High-growth businesses typically exhibit strong engagement metrics, such as likes, shares, comments, and clicks per post, along with steadily increasing follower counts. Monitoring these metrics weekly can help you catch shifts in consumer interest and gauge overall company health.
A significant amount of social-referral traffic suggests that a store’s marketing strategy is effectively converting social media audiences into website visitors. With social commerce in the U.S. projected to reach nearly $100 billion by 2026, platforms like Instagram and TikTok are becoming critical growth channels. Brands enabling direct checkouts through these platforms often scale faster.
Keep an eye on the frequency and scope of influencer collaborations, as these partnerships often lead to sales surges within four to six weeks. Positive social sentiment and a high Net Promoter Score (NPS) are also strong predictors of repeat purchases. Additionally, brands that post contextually relevant content tied to events or seasonal trends demonstrate a commitment to marketing that drives both engagement and loyalty.
"Leading indicators move ahead of outcomes and let you steer performance early." – Marijana Kay and Michael Keenan, Shopify
While external signals like social media are vital, tracking product expansion offers another compelling way to identify scalable growth.
Tracking Product Expansion
Expanding into new product categories is often a sign of a thriving business. Stores that successfully diversify their offerings usually exhibit strong inventory turnover ratios, indicating efficient sales and restocking processes. Monitoring metrics like Average Inventory Sold Per Day can help identify which new products (SKUs) are performing well.
A sudden increase in stockout or low-stock alerts can signal that demand for new or expanded product categories is outpacing supply - an unmistakable indicator of rapid growth. On the flip side, tracking return and refund rates by category can uncover potential quality issues or mismatched product descriptions that could hinder growth.
Other leading indicators include page views on category-specific blog posts or gift guides, which can gauge interest before committing to a full-scale product launch. Expanding the variety of products not only attracts new customers but also boosts repeat business, making product diversification a reliable marker of long-term growth potential.
Using StoreCensus for Automated Growth Detection
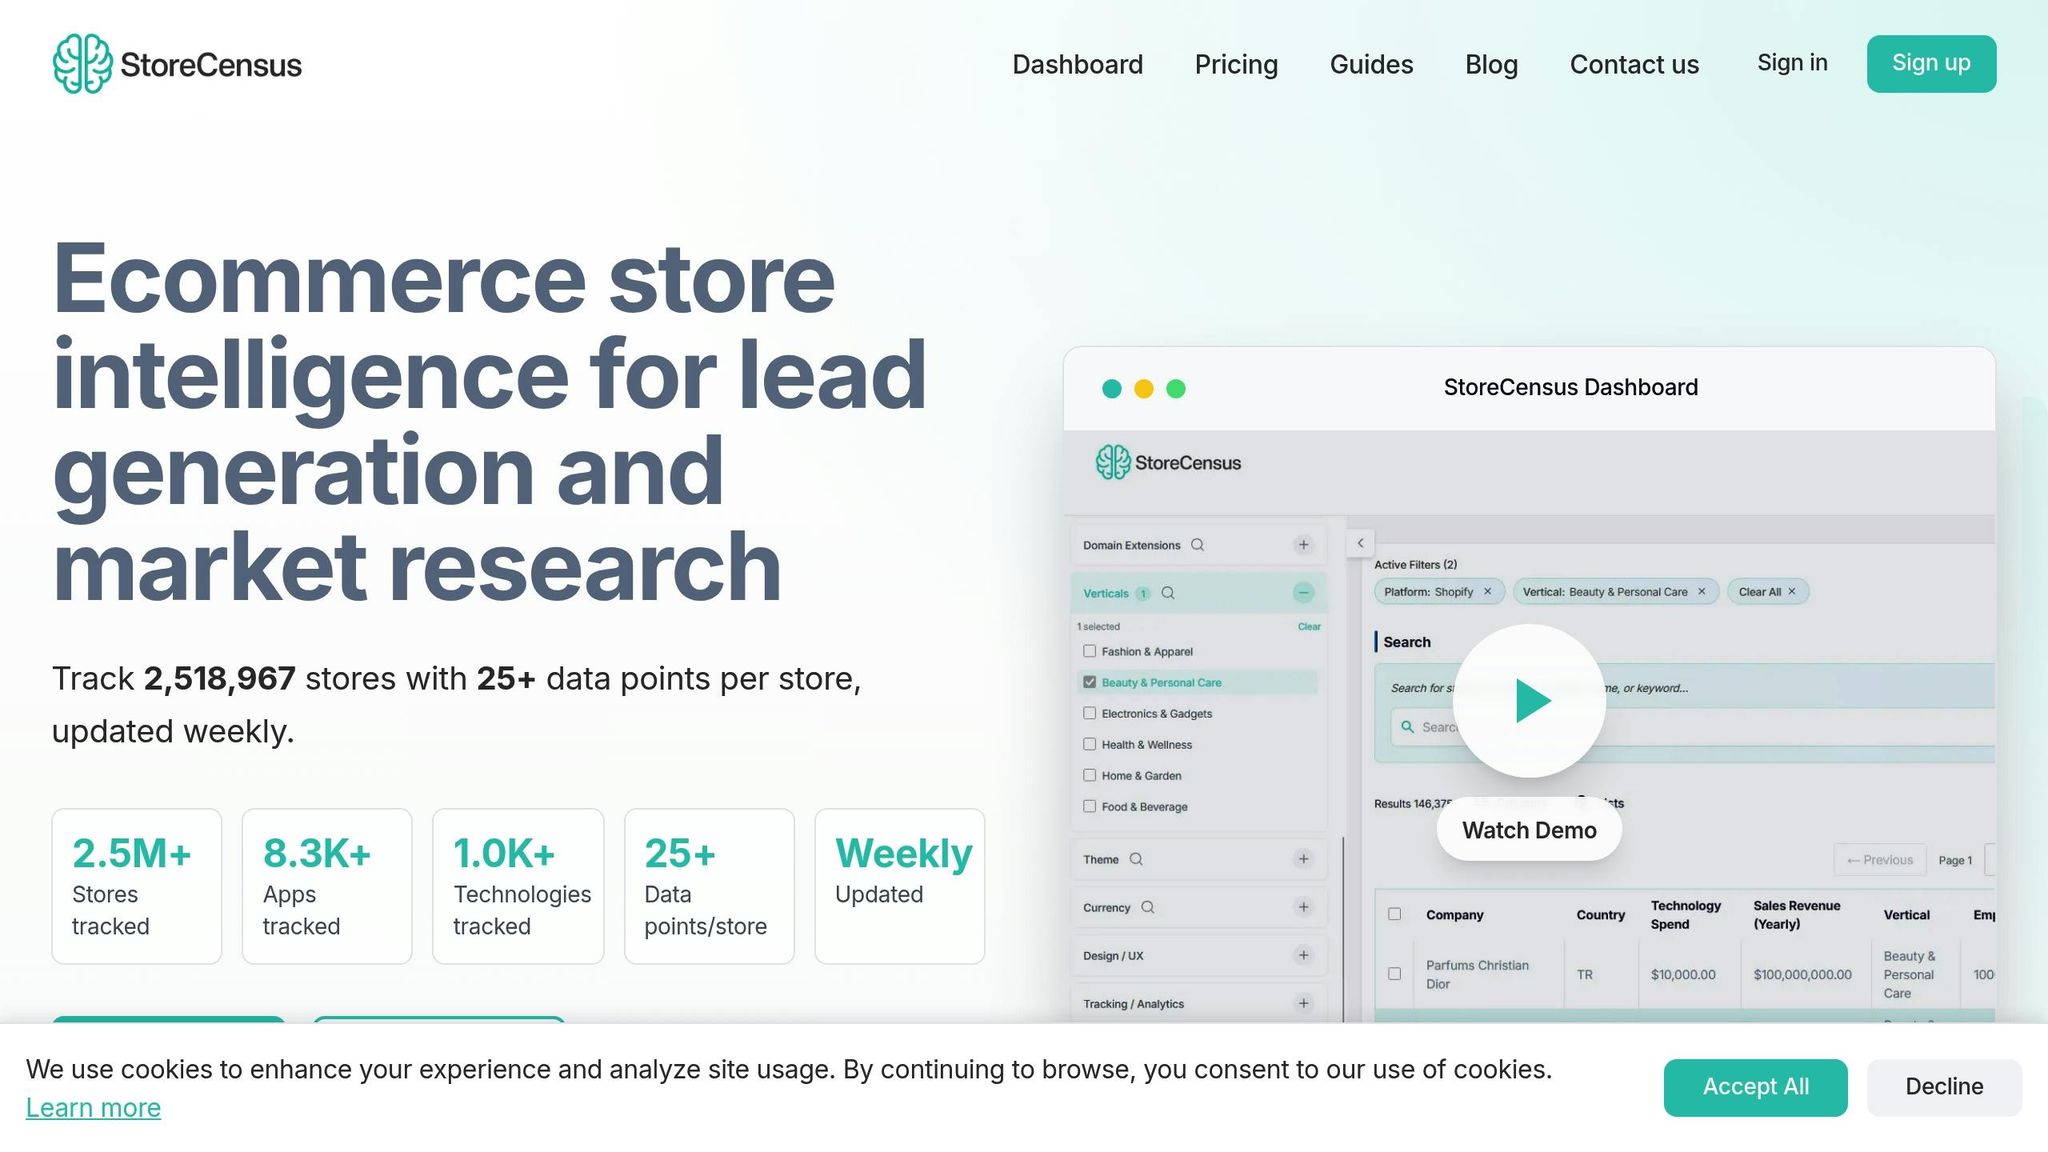
Tracking growth signals manually is nearly impossible when dealing with thousands of data points. This is where automation steps in to simplify the process. While manual research can provide valuable insights, automating the tracking of thousands of ecommerce stores is essential for efficiency. StoreCensus combines critical growth signals - like traffic, social metrics, and product data - into a single automated platform. It monitors over 2.5 million ecommerce stores, collecting 25+ data points per store, and updates weekly with a 99.2% data accuracy rate. Next, let’s explore how its advanced filtering capabilities can refine your targeting strategy.
Advanced Filtering for Targeted Insights
StoreCensus enables you to layer multiple filters, making it easier to zero in on high-growth opportunities. You can segment stores based on estimated revenue ranges (e.g., $1M–$10M annually), their tech stack (like Klaviyo or Rebuy), location (down to specific U.S. states), and social signals. For instance, you might filter for beauty brands earning $500K–$2M annually that use Klaviyo but not Rebuy - ideal candidates for recurring revenue growth.
The platform tracks over 8,300 apps and 1,000+ technologies, helping you identify stores upgrading their infrastructure. Agencies using these filters have reported 150% growth and a 40× ROI. Revenue estimates, which consider factors like traffic, product catalog size, and app usage, are approximately 70–85% accurate within their predicted range.
One standout strategy involves monitoring competitor churn. When a store uninstalls a competitor's app, automation can trigger immediate outreach. This approach often leads to a 40% conversion rate and response rates 3–5× higher than standard cold outreach.
Real-Time Updates and Historical Data
StoreCensus performs daily crawls to capture changes such as new app integrations, theme updates, or shifts in revenue bands, while refreshing its entire database weekly. This blend of real-time insights and historical snapshots allows you to follow growth trends over time. For example, you might notice that techstore.com recently added Klaviyo, or that fashionbrand.com moved from the $100K to $250K revenue tier.
Historical data also provides a window into trends like app adoption and changes in technology stacks within specific industries. This makes it easier to spot stores entering high-growth phases or track which marketing tools are gaining traction. All of this is achieved without the hassle of manual web scraping, offering normalized and verified data. These insights feed directly into smart lead scoring, as outlined below.
Automated Lead Scoring and Workflow Integration
StoreCensus includes "Evergreen Automations" that operate continuously, triggering workflows whenever stores show buying intent. These intent-based triggers detect technical updates and can initiate personalized outreach immediately. For example, if a store updates its tech stack or adds a new marketing tool, the system automatically increases its lead score and sends the lead to your CRM. Similarly, when a store removes a competitor's app, it signals they're looking for alternatives - an ideal time to reach out.
The platform integrates seamlessly with tools like HubSpot, Salesforce, Mailchimp, Slack, and Notion through Zapier, connecting with over 5,000 apps. Filtered lists can also sync directly with Apollo and Instantly.ai, providing verified contact details - like emails, job titles, and LinkedIn profiles - for immediate outreach. Additionally, the StoreCensus API supports bulk data enrichment, helping you enhance your existing lead databases by leveraging 25+ data points.
For agencies, aligning your service pricing with store revenue is a smart move. Target stores where your monthly retainer represents about 0.5–1% of their annual revenue, ensuring affordability and higher conversion rates. Combining revenue filters with "ready to spend" signals - like active Facebook ad campaigns featuring 20+ variations or recent product launches - can further refine lead scoring, helping you focus on prospects most likely to convert.
Validating and Prioritizing High-Growth Leads
Cross-Checking Key Metrics
Spotting rising revenue is just the first step - you need to ensure that growth is both sustainable and profitable. Start by comparing Customer Acquisition Cost (CAC) to Customer Lifetime Value (CLV). If your CAC is higher than your CLV, the growth isn’t built to last.
Dive deeper into profitability metrics like Gross Margin and Monthly Burn Rate to confirm that the growth isn’t fueled by excessive spending. Retention metrics are equally important. A high Repeat Purchase Rate (RPR) and low Customer Churn Rate show that loyal customers, not just one-time buyers, are driving growth. For instance, a two-point drop in a rolling seven-day Net Promoter Score (NPS) can predict a decline in repeat purchases within four to six weeks. Additionally, quality issues play a big role - around 55% of customers return products due to quality concerns, making the return rate a strong indicator of product-market fit.
External signals also matter. For example, among the top 25% of fastest-growing ecommerce stores, 96.97% use online advertising, and those leveraging paid ads grow 3.67 times faster than those that don’t. When a business combines high advertising activity on platforms like Google and Meta with strong product margins (ideally 5×, with 30× being the ultimate goal for breakout brands), it’s a clear sign of confident investment in growth.
While these metrics are essential for validation, scaling this process manually can become overwhelming. That’s where the StoreCensus API comes into play.
Using StoreCensus API for Bulk Analysis
When managing large volumes of leads, manual validation isn’t realistic. This is where automation becomes critical. The StoreCensus API enriches each lead with over 25 data points, including revenue bands, changes in tech stack, product catalog size, and social signals. These data points are updated weekly with an impressive 99.2% accuracy.
The API also offers access to historical data going back to February 2019, enabling you to track long-term growth trends and technology adoption patterns. You can even set up real-time alerts to monitor when a store shifts revenue tiers or updates its tech stack. For example, tracking a store as it moves from the $100,000 to $250,000 revenue tier or adds new marketing integrations can signal strong buying intent.
With this tool, you can segment leads by revenue tiers (e.g., $1M–$5M or $10M+), ensuring they align with your service pricing and capacity. The enriched data can be exported directly into CRMs like HubSpot, Salesforce, or Pipedrive for immediate follow-up. Alternatively, you can push it to a CSV file for offline analysis and custom lead scoring.
The API is accessible through the Professional plan at $79/month, with advanced features and full historical data available in the Enterprise plan priced at $599/month. This makes it an essential tool for streamlining lead prioritization and targeting high-growth opportunities effectively.
Conclusion
Spotting high-growth ecommerce stores isn’t just about finding prospects - it’s about focusing on the ones with the greatest potential for long-term success. Prioritizing stores with strong customer lifetime value and profitability ensures your resources are spent where they’ll yield the best results. With global ecommerce sales expected to reach $5.1 trillion by 2026, the possibilities are immense - if you know where to look.
Relying on manual prospecting is quickly becoming outdated. Agencies leveraging store intelligence tools report average growth rates exceeding 150%, while businesses using advanced filters to zero in on ecommerce prospects see a 40× ROI. Real-time insights - like revenue changes or updates to a store’s tech stack - let you engage at the perfect moment, ensuring you’re not reaching out months too late. This proactive approach is reshaping how industry leaders operate.
"Find a new brand before it goes big... react before the rest of the market." - Store Leads
Platforms like StoreCensus make this process seamless. By automating lead scoring, tracking competitor app uninstalls, and delivering real-time alerts, StoreCensus takes the guesswork out of prospecting. With features like advanced tracking and CRM integration, it allows you to act on predictive signals rather than relying solely on outdated metrics.
The key takeaway? Using data intelligence gives you the edge to seize emerging opportunities with accuracy and speed. The fastest-growing brands today aren’t leaving their success to chance - they’re using data to identify and act on growth signals. With the right tools and strategy, you can do the same.
FAQs
What metrics can help identify fast-growing ecommerce stores?
To identify booming ecommerce stores, keep an eye on critical metrics like revenue growth, website traffic patterns, and conversion rates. These numbers offer a clear picture of how well a store is performing and its potential to scale.
You should also look at factors like average order value (AOV), repeat purchase rate, and customer acquisition cost (CAC). Stores that show steady progress in these areas, paired with a varied product lineup, often indicate a flourishing ecommerce operation.
How does StoreCensus help identify fast-growing ecommerce stores?
StoreCensus monitors over 2.7 million ecommerce sites, analyzing more than 25 data points for each store. These include metrics like estimated revenue, website traffic, installed apps, and social media activity. With weekly updates, the platform highlights key growth indicators such as revenue increases, traffic surges, adoption of new technologies, and heightened social engagement.
The platform's advanced filtering tools let you zero in on stores based on specific metrics, export data for deeper analysis, or connect it directly to automated systems using an API. Real-time alerts keep you informed of critical changes - whether it’s a store hitting revenue milestones like $500K or $1M, or adopting impactful tools - so you can seize partnership or lead opportunities without delay. Plus, built-in CRM integration and access to decision-maker contact details make it easy to translate these insights into actionable strategies.
Why is the repeat purchase rate crucial for ecommerce growth?
The repeat purchase rate is a crucial metric for measuring customer loyalty and ensuring long-term success in ecommerce. It reflects how frequently customers come back to make additional purchases, directly influencing recurring revenue while minimizing the reliance on expensive customer acquisition strategies.
When the repeat purchase rate is high, it often points to satisfied customers who trust your brand. This not only strengthens the relationship with your audience but also lays the groundwork for steady growth. By cultivating loyalty, businesses can create a more reliable revenue stream and boost overall profitability over time.