Top Growth Indicators for Shopify Competitors
Monitor app churn, pixel adoption, revenue tiers, and real-time tech changes to identify high-intent Shopify competitors and growth opportunities.


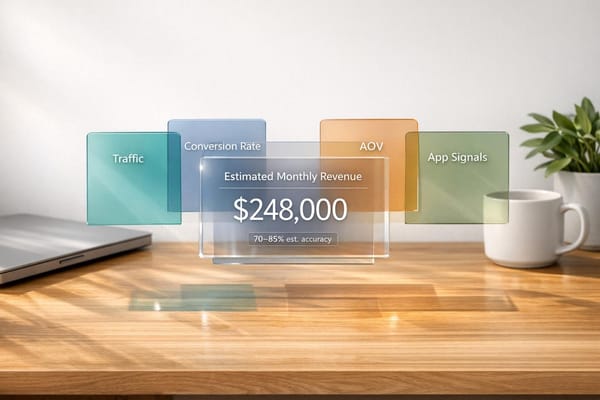
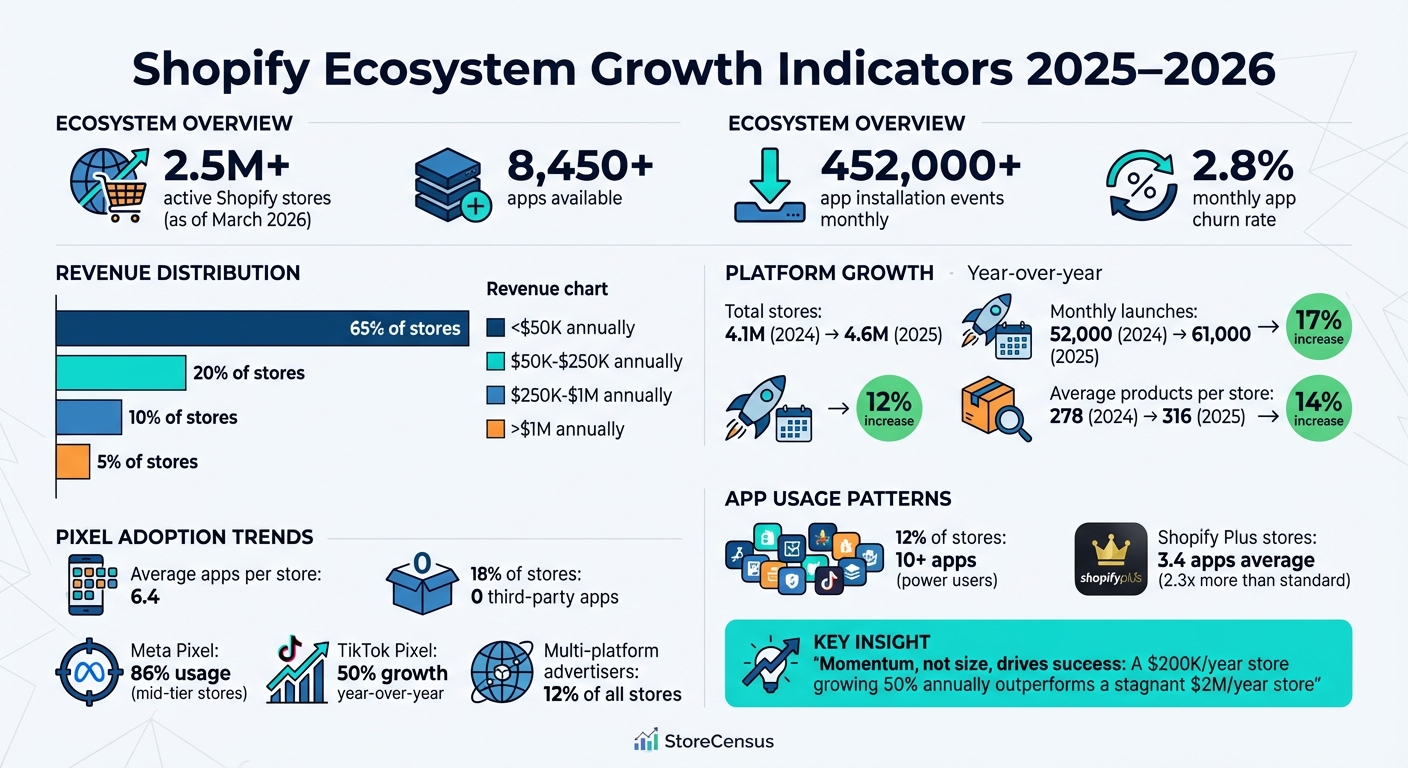
Ecommerce is evolving rapidly, and staying competitive means tracking key growth signals. As of March 2026, Shopify hosts 2.5M+ active stores and 8,450+ apps, with over 452,000 app installation events happening monthly. These shifts reveal opportunities for SaaS providers and agencies to target merchants based on their tech stack changes, revenue tiers, and marketing activity.
Key insights:
- App churn rate: 2.8% monthly, signaling frequent tech stack updates.
- Revenue distribution: 65% of stores earn <$50K annually; 5% exceed $1M.
- Pixel adoption: Meta Pixel leads (86% usage for mid-tier stores), TikTok Pixel adoption grew 50% last year.
- Regional growth: Latin America and Asia are hotspots, with platforms like Tiendanube and Cafe24 gaining traction.
- Timing matters: Automated alerts on app installs/removals help engage merchants when intent is highest.
Momentum, not size, drives success. Tools like StoreCensus track these signals in real-time, helping businesses act on changes across 2.5M+ stores.
Shopify Ecosystem Growth Indicators 2025-2026: Key Statistics and Trends
How To Find Top Shopify Stores | Competitor Research for Beginners

Key Growth Indicators for Shopify Competitors
Understanding growth metrics isn't just about numbers - it's about identifying trends, shifts, and strategies that point to where the market is heading. Let’s break down some of the most telling indicators.
App Installations and Removals
App activity is a powerful lens into merchant behavior. On average, Shopify stores use 6.4 apps, though there's a wide range: 18% of stores don’t use third-party apps at all, while 12% are "power users" with 10 or more apps installed. Interestingly, there’s a 2.8% monthly churn rate for app installations, which translates to over 452,000 install and uninstall events every month. This constant flux reflects how merchants fine-tune their tech stacks, often reacting to pricing, functionality, or new competitors. For example, Essential Announcement Bar saw a steep 19.5% decline in 90 days, losing 7,198 installs as newer options entered the market.
Sophistication plays a role, too. Shopify Plus stores, which cater to larger businesses, average 2.3 times more apps (3.4) and 2.4 times more tracking pixels (5.5) than standard stores. Stores with over 1 million monthly visitors use 64% more apps compared to smaller stores with under 10,000 visitors. However, app usage tends to level off for stores in the 50k–200k monthly visitor range, stabilizing at around 3.6 to 3.8 apps.
StoreCensus monitors app activity in real time, helping businesses connect with merchants precisely when they’re exploring new tools or replacing old ones.
Revenue Growth and Gross Merchandise Value (GMV)
Revenue distribution offers a glimpse into the ecosystem’s health. Among Shopify stores, 65% generate less than $50,000 annually, 20% earn between $50,000 and $250,000, 10% fall in the $250,000–$1 million range, and only 5% exceed $1 million. Since external revenue estimates are only 30–50% accurate due to limited order data access, analysts often rely on proxies like traffic levels and app usage. For instance, stores with 50k–200k monthly visitors often align with $250,000–$1 million in annual revenue.
Revenue tiers also influence how quickly decisions are made. Smaller stores tend to move fast, while those earning $1 million–$5 million annually involve more stakeholders, leading to longer procurement cycles of 1–3 months. The $50,000–$1 million range is particularly attractive for SaaS providers, as it combines budget flexibility with relatively quick decision-making.
StoreCensus helps users filter merchants by revenue range, combined with other indicators like Shopify Plus status, app usage, and traffic levels, to pinpoint growth opportunities.
Store Launch and Closure Rates
The pace of new store creation reflects platform momentum. Shopify’s global store count grew from 4.1 million in 2024 to 4.6 million in 2025, marking a 12% year-over-year increase. Monthly store launches also accelerated, jumping 17% year-over-year from 52,000 in 2024 to 61,000 in 2025. These trends provide valuable timing cues for agencies looking to engage new merchants.
Merchant Segmentation by Revenue Tiers
Segmenting merchants by revenue unveils clear behavioral patterns. Here’s how decision speed and characteristics vary by revenue range:
| Revenue Range (Yearly) | Merchant Segment | Characteristics | Decision Speed |
|---|---|---|---|
| $50k - $100k | Growing | Price-conscious; entry-level tools | Fast (1–2 weeks) |
| $100k - $500k | Established | Budget-aware; mid-tier solutions | Medium (2–4 weeks) |
| $500k - $1M | Scaling | Ready to invest; prefers premium apps | Medium (3–6 weeks) |
| $1M+ | Advanced | Focused on efficiency; enterprise-grade tools | Slow (1–3 months) |
Merchants also follow a predictable path when it comes to themes. Low-traffic stores often stick with free themes (37% adoption), while growing stores move to paid themes ($180–$400). High-revenue stores eventually invest in custom themes, which can range from $5,000 to $50,000 or more.
Activity Signals and Technology Stack Changes
Real-time activity signals often reveal growth before revenue data catches up. Key indicators include app installations, pixel adoption, theme upgrades, and product catalog expansions. For example, the average product count for active stores rose 14% from 278 to 316 between 2024 and 2025.
Pixel adoption is particularly revealing. Meta Pixel is used by 86% of stores with 50k–200k monthly visitors, and TikTok Pixel adoption grew by 50% year-over-year in 2025. Stores using multiple pixels - such as Meta, TikTok, Pinterest, and Snapchat - indicate a diverse advertising strategy and substantial marketing investment.
Analyzing app clusters can also provide insights into merchant priorities. For instance:
- A store using Meta Pixel, Klaviyo, and TikTok Pixel is likely focused on growth and ROI.
- A store relying on PageFly and Judge.me might need help with design and conversion optimization.
- A Shopify Plus store leveraging Yotpo and GA4 often signals an enterprise-level operation.
Analytics tools are also gaining traction. Triple Whale doubled its user base in just three months as of March 2026, while Sense UTM Analytics grew by 95.1%. This highlights the growing importance of advanced attribution and profit tracking as acquisition costs rise.
StoreCensus tracks these activity signals in real time, offering insights into app changes, design updates, and other store-level modifications. These data points enable targeted outreach at critical decision-making moments.
Regional Growth Trends and Emerging Markets
Fastest-Growing Markets for Ecommerce Platforms
Geography plays a critical role in understanding where ecommerce platforms are gaining ground. Shopify boasts an impressive global reach with 4.6 million active stores, but the real intrigue lies in the regional growth patterns and how local platforms are making their mark.
Latin America stands out as a booming region for ecommerce. Tiendanube, also known as Nuvemshop, supports 181,563 active stores by offering tailored solutions like localized payment gateways and shipping integrations - features often missing in global platforms. In Brazil, Loja Integrada adds another 25,371 stores to the mix, underscoring the appeal of region-focused offerings.
In Asia, the market is highly fragmented but thriving. South Korea’s Cafe24 leads with 116,076 active stores, while SHOPLINE has captured 30,468 stores across Southeast Asia. Japan’s BASE platform supports 62,507 merchants, and Vietnam’s Haravan powers 8,908 stores. These platforms succeed by catering to specific regional needs, such as offering local languages, currencies, and payment systems, making them indispensable to merchants.
The Middle East and North Africa (MENA) region is also seeing rapid adoption of ecommerce platforms. YouCan leads with 43,235 active stores, followed by Zid with 8,867 and Salla with 4,404. While these numbers may seem modest compared to global giants, they represent significant progress in regions with evolving ecommerce infrastructure.
Emerging markets are also seeing a surge in social-commerce tools. For instance, TikTok Pixel adoption has reached 18% among active stores in beauty and skincare, with a 60% increase in relevant segments. This trend highlights the growing influence of mobile-first, social-driven shopping, particularly in regions where traditional ecommerce is still developing. These shifts point to new opportunities for merchants to embrace cross-border commerce and expand their reach.
Cross-Border Commerce and International Expansion
The diverse regional dynamics are fueling international expansion as merchants adapt their strategies to new markets. A major trend here is the rise of multi-platform advertising. Stores that utilize both Meta and TikTok pixels have grown by 50% year-over-year, with 12% of all stores now running campaigns across multiple social platforms.
Merchants are also increasing their ad budgets. In 2025, the average monthly ad spend for active advertisers rose by 17%, ranging between $2,800 and $8,500. This willingness to invest in multiple acquisition channels reflects a strong push to capture new audiences. However, there’s still room for improvement - 34% of ad-running stores lack email integration, leaving gaps in unified reporting and attribution across regions.
Platforms like StoreCensus provide valuable insights by tracking store growth across regions and technologies. These tools help businesses identify early signals of international expansion, such as the adoption of new marketing pixels or increased cross-platform advertising by Southeast Asian stores. These trends often hint at cross-border ambitions long before they show up in revenue figures, offering a competitive edge to those who act quickly.
Tracking Competitive Shifts with Real-Time Data
Real-Time Tracking of Store-Level Changes
With over 450,000 app installation events happening every month, staying on top of these changes in real time is crucial to understanding merchant intent. Relying on traditional data snapshots just doesn’t cut it anymore - you need live tracking to catch those moments when intent first appears.
Real-time monitoring zeroes in on active installations and storefront behaviors, rather than outdated metrics like download counts. For instance, when a merchant installs a subscription-based app, it signals a move toward recurring revenue. If they uninstall a competitor’s tool, it could indicate dissatisfaction or an expiring contract. These small but pivotal shifts create brief windows of opportunity for outreach.
Here’s the bottom line: momentum matters more than size. As Nick, the founder of StoreCensus, explains:
"A $200k/year store growing 50% annually is a better prospect than a $2M/year store that's stagnant".
By tracking recent app installs, new pixels, or catalog expansions, you can identify high-potential prospects before your competition does. Platforms like StoreCensus monitor changes across 2.5 million ecommerce stores, updating data weekly to reflect shifts in technology stacks, themes, and tracking pixels. Given how quickly these changes happen, automating the detection of these signals is no longer optional - it’s essential.
Automation and Alerts for Growth Signals
Automation takes the guesswork out of identifying and acting on growth opportunities, freeing teams from sifting through endless data. Instead, it enables instant action.
Trigger-based workflows turn growth signals into immediate opportunities. For example, when a store installs a complementary app, an automated alert can prompt sales outreach within hours. If a store upgrades from a free theme to a paid one, it shows an increased willingness to invest, signaling potential budget availability. StoreCensus allows users to set up these workflows, automatically triggering sales or nurturing campaigns based on changes like app installations, removals, or design updates.
The trick is timing your outreach to the signal. For instance, reaching out right after detecting a missing app - when a store uses one tool but lacks its complementary counterpart - creates the perfect opening for a personalized pitch. On the other hand, waiting just long enough before a competitor’s contract ends positions your solution as the perfect replacement. These automated alerts ensure your team connects with prospects when their intent is at its peak, avoiding cold and poorly-timed outreach altogether.
Conclusion
Success in the Shopify ecosystem hinges on keeping an eye on key signals - like app usage, revenue patterns, and store updates. These metrics highlight why having agile, automated monitoring tools is so important. When it comes to competitive analysis, momentum often outweighs sheer size. For instance, Shopify Plus stores use 2.3 times more apps and 2.4 times more pixels than standard stores. These patterns make it easier to spot high-growth opportunities.
With over 452,629 app events happening each month, manual tracking simply isn’t feasible. That’s why a data-driven system is crucial. By constantly monitoring millions of stores and alerting you to emerging growth signals, tools like StoreCensus make all the difference. Covering over 2.5 million active stores with weekly updates on automating app installs and removals, it ensures you’re always a step ahead.
FAQs
Which Shopify growth signals matter most?
Growth in Shopify stores can often be spotted by keeping an eye on app activity, revenue trends, and store activity signals.
- App Activity: Frequent installation or removal of apps can reveal changes in a store's tech stack or hint at scaling efforts. For example, adding advanced analytics tools might suggest a focus on optimizing performance.
- Revenue Changes: Hitting new revenue milestones is a clear sign of a store experiencing rapid growth. These milestones often indicate successful strategies or product demand.
- Store Activity Signals: Updates to store design, noticeable traffic shifts, or even new product launches can highlight evolving trends and strategies.
By keeping track of these factors, you can get a clear picture of which stores are growing and where new opportunities might be emerging.
How do I use app churn to find high-intent leads?
Monitoring app uninstall trends over a set period, such as 90 days, can reveal stores experiencing notable app churn - uninstall rates ranging from -8% to -35%. These businesses might be reworking their tech stack or encountering hurdles, which could make them more receptive to exploring new solutions. By keeping an eye on real-time app removals, you can pinpoint the ideal moment to reach out, boosting your chances of meaningful engagement.
What alerts should I automate in StoreCensus?
StoreCensus can automatically send you alerts for important growth and activity signals, including:
- App installations and removals: Stay updated on rising or fading apps.
- Revenue or traffic shifts: Spot growth opportunities or potential declines.
- Technology stack changes: Get notified when new tools are added or old ones are removed.
- Business activity updates: Keep tabs on design overhauls or new product launches.
These alerts make it easier to prioritize leads, fine-tune outreach strategies, and stay on top of market trends - all in real time.