How to Estimate Shopify Store Revenue
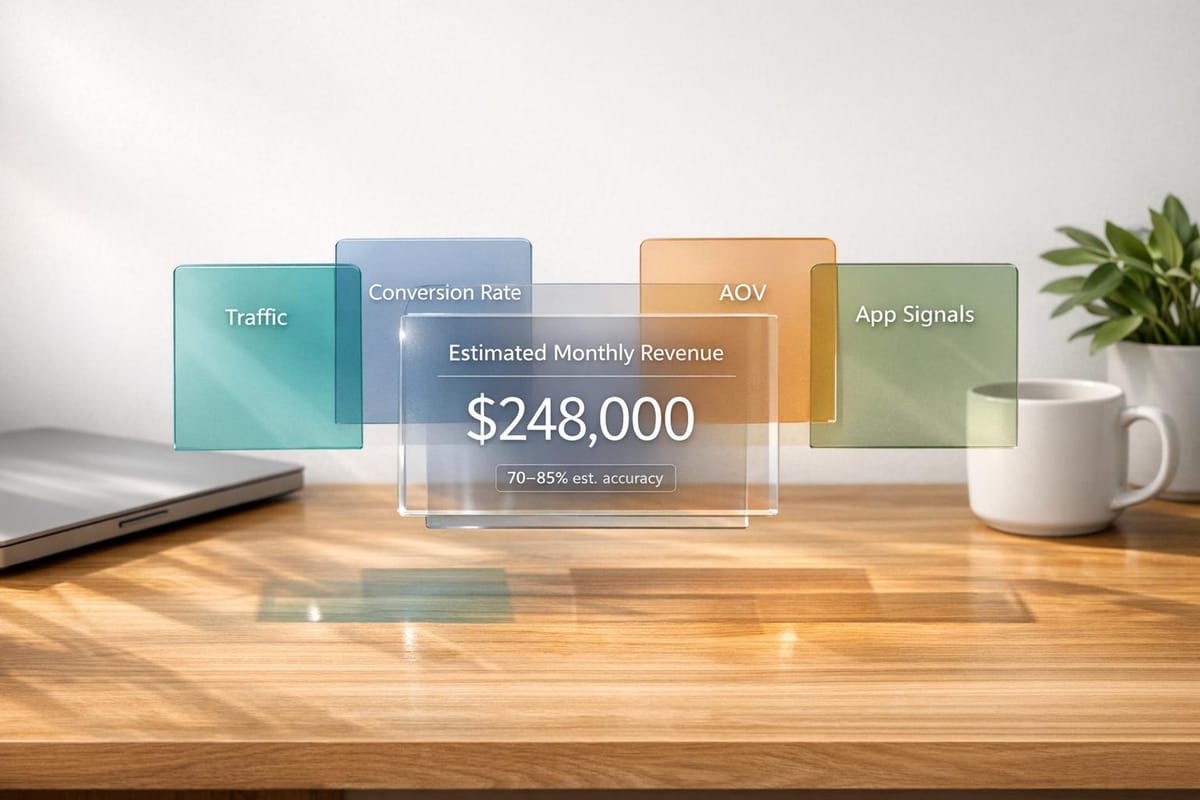
Combine traffic, conversion rates, AOV and app signals into a simple formula to estimate a Shopify store's monthly revenue with 70–85% accuracy.

Estimating a Shopify store's revenue boils down to analyzing key metrics like traffic, conversion rates, and average order value (AOV). Since Shopify doesn't make sales data public, you can use tools and benchmarks to create accurate revenue models. Here's a quick breakdown:
- Traffic: Use tools like SimilarWeb to estimate monthly visitors. Organic traffic converts better (3.6%) than paid social traffic (0.8%-1.2%).
- Conversion Rates: Vary by category. For example, fashion stores average 1.5%, while gifts hit 4.9%.
- AOV: Calculate the average price of top products. Most stores fall between $50 and $100.
- Tech Stack: Apps like Klaviyo or Shopify Plus signal higher revenue levels (e.g., $20K+ or $500K+ monthly).
- Repeat Purchases: Often account for over 40% of total revenue.
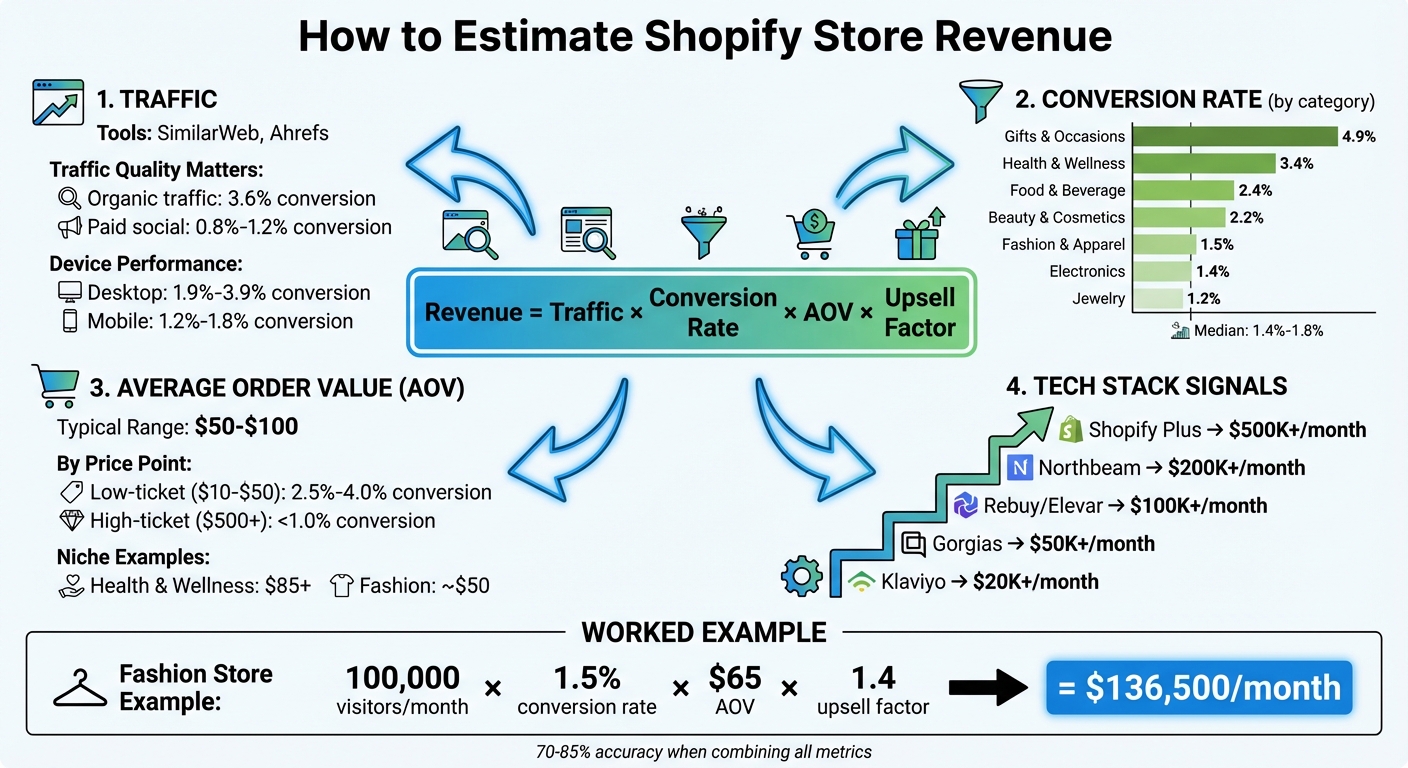
By combining these metrics into a formula - Revenue = Traffic × Conversion Rate × AOV × Upsell Factor - you can estimate a store's monthly earnings with 70-85% accuracy. Tools like StoreCensus simplify this process by tracking app usage and growth signals across millions of stores.
Example: A fashion store with 100,000 visitors/month, a 1.5% conversion rate, and a $65 AOV would generate approximately $136,500/month when factoring in repeat sales.
This approach helps agencies, SaaS founders, and competitors identify high-value opportunities and avoid low-revenue prospects.
How to Estimate Shopify Store Revenue: 4-Step Framework with Key Metrics
How to find any Shopify Store's Revenue Accurately

Key Metrics for Revenue Estimation
Understanding traffic, conversion rates, and average order value (AOV) is essential for estimating revenue. Accuracy typically ranges between 50% and 70%, so it's crucial to evaluate traffic, conversion, and pricing data together rather than relying on one metric alone.
Traffic and Session Data
Tools like SimilarWeb and Ahrefs provide monthly visitor estimates, but their accuracy varies. For stores with less than 100,000 visitors, these estimates can be off by 30-50%. However, for larger stores with higher traffic, the data becomes more dependable.
Not all traffic is created equal. Organic search traffic tends to convert at an average rate of 3.6%, while paid social traffic from platforms like Facebook and TikTok converts at a lower rate of 0.8% to 1.2%. Desktop users generally convert better - 1.9% to 3.9% - compared to mobile users, who convert at 1.2% to 1.8%.
Metrics like bounce rate and page speed also play a role. High bounce rates (above 70%) or slow page loads (over 4 seconds) indicate poor traffic quality, which reduces the effective traffic for revenue calculations. To validate traffic engagement, look at session duration and pages per visit. Once engaged traffic is identified, apply conversion benchmarks specific to the product category and traffic source.
Conversion Rate Benchmarks
The median conversion rate for Shopify stores is around 1.4% to 1.8%, but this varies significantly by product category. For example, stores selling gifts and occasions achieve conversion rates as high as 4.9%, while jewelry stores average just 1.2% due to their higher price points and longer decision-making cycles.
Here’s a breakdown of conversion rates by category:
| Category | Avg Conversion Rate | Notes |
|---|---|---|
| Gifts & Occasions | 4.9% | High intent, seasonal |
| Health & Wellness | 3.4% | Repeat buyers, subscriptions |
| Food & Beverage | 2.4% | Consumables drive loyalty |
| Beauty & Cosmetics | 2.2% | Intense competition |
| Fashion & Apparel | 1.5% | Browsers > buyers |
| Electronics | 1.4% | High research, price sensitivity |
| Jewelry | 1.2% | High price, low conversion |
Using category-specific benchmarks helps avoid estimation errors that could be off by a factor of two or more. For high-ticket items priced at $500 or more, conversion rates typically fall below 1.0% as buyers require more time to research. On the other hand, low-ticket items priced between $10 and $50 often have conversion rates of 2.5% to 4.0% due to fewer purchase barriers.
Average Order Value (AOV)
AOV measures the revenue generated per transaction. To calculate it manually, average the prices of the top 10 products in a store’s catalog. Alternatively, you can use Shopify’s /collections/all?sort_by=best-selling URL trick to identify the best-performing products.
Most general Shopify stores have an AOV ranging from $50 to $100, though this varies by niche. For instance, health and wellness stores often average $85+, while fashion stores typically hover closer to $50. Stores with high AOVs (over $150) can sustain higher customer acquisition costs compared to stores with low AOVs (under $35).
"A store doing $3M annually with a $150 AOV and 40% repeat purchase rate can afford to spend way more on marketing than a store doing $3M with a $35 AOV and 5% repeat rate." - StoreCensus
Incorporating repeat purchase behavior is also critical. Repeat purchases can account for over 40% of total revenue. Stores with strong repeat purchase rates will exceed revenue estimates based solely on new visitor traffic, providing a more comprehensive picture of their performance.
Using Technology Stack and Apps as Revenue Indicators
A store's tech stack can be a powerful clue about its revenue potential, often offering insights beyond basic traffic and conversion data. Why? Because stores typically won't spend $300–$500 per month on apps unless their revenue supports it. On average, Shopify stores use about 6.4 apps, but stores with higher earnings often rely on more advanced and expensive tools.
Identifying High-Revenue Apps
Some apps are strong indicators of a store's revenue due to their pricing and complexity. For example:
- Klaviyo: Suggests a store is generating at least $20,000 per month.
- Gorgias: Points to revenues of $50,000+ per month.
- Rebuy or Elevar: Typically used by stores earning over $100,000 monthly.
- Northbeam: Indicates revenues exceeding $200,000 per month.
- Shopify Plus: Reserved for stores making over $500,000 per month.
Additionally, the number of tracking pixels a store uses can hint at its advertising scale. For instance, stores running six or more tracking pixels (like Meta, TikTok, Pinterest, or Snapchat) often have a diversified ad strategy and a significant marketing budget. There's also a clear link between traffic levels and app usage: stores with fewer than 10,000 monthly visitors average 2.2 apps, while those with 1–5 million visitors average 4.4 apps.
Using StoreCensus for App Data
StoreCensus simplifies the process of analyzing app usage by tracking over 2.5 million ecommerce stores. It offers more than 25 structured data points, including app installations, growth trends, and tech stack changes. You can use its advanced filters to pinpoint specific types of stores. For example:
- Identify scaling brands by filtering for stores using ReCharge and Gorgias while excluding Shopify Plus.
- Generate targeted lists, such as stores earning $1M–$5M monthly that use Klaviyo but not Rebuy, to identify those likely to benefit from AOV optimization tools.
App data complements traffic and conversion metrics, offering a quick snapshot of a store's investment in growth. StoreCensus updates its revenue estimation models weekly, achieving 70–85% accuracy by correlating app usage with revenue ranges. Real-time alerts for app installations or upgrades often signal upcoming growth opportunities.
Using Growth Signals and Historical Trends
When it comes to understanding a store's revenue potential, growth signals and historical trends offer insights that go beyond just traffic or app data. A snapshot of a store's current performance can be misleading if you ignore its growth trajectory. As Nick, Founder of StoreCensus, explains:
"Momentum beats size every time. A $200k/year store growing 50% annually is a better prospect than a $2M/year store that's stagnant".
Tracking Store Changes Over Time
Historical data gives you a clearer picture of trends that single-day metrics simply can't provide. For instance, when a store upgrades its tech stack - like moving from Mailchimp to Klaviyo - it often indicates that the business has entered a higher revenue bracket and is prepared to handle increased costs. Another key indicator is catalog growth. In 2025, the average product count for active Shopify stores grew from 278 to 316 SKUs, marking a 14% year-over-year increase.
StoreCensus keeps tabs on these changes by tracking app installations, removals, and design updates over time. This approach helps identify stores that are actively growing, rather than just highlighting large, established ones. Combining historical trends with real-time monitoring provides a more nuanced understanding of revenue potential.
Real-Time Monitoring for Revenue Estimation
While historical data shows long-term patterns, real-time data offers immediate insights into a store's growth trajectory. For example, the installation of a TikTok Pixel or multiple new marketing tools often signals active customer acquisition efforts. In 2025, TikTok Pixel installations increased by 50%, reflecting this trend. Similarly, stores with 20 or more active ad variations in the Meta Ad Library tend to maintain strong revenue streams and significant marketing budgets.
StoreCensus enhances this with real-time alerts for critical changes, such as the installation of Rebuy or an upgrade to Shopify Plus. These updates often indicate both growth intent and available budget. Spotting these signals early allows you to refine revenue estimates before quarterly reports come out or reach out to prospects when their buying intent is at its highest.
Applying Revenue Estimation Formulas
Once you’ve got your traffic data, conversion rates, and average order values (AOV) in hand, it’s time to combine them. The formula is simple: Revenue = Traffic × Conversion Rate × AOV × Upsell Factor. While each part of this equation is important, the upsell factor often gets overlooked. And that’s a mistake - repeat purchases driven by email and SMS campaigns can make up more than 40% of a store’s total revenue. Ignoring it could leave your revenue estimate way off the mark.
Revenue Estimation Formula
These metrics come together to form a practical model for estimating revenue. Start by pulling monthly traffic data using tools like SimilarWeb or SEMrush. Keep in mind, these tools might underestimate traffic for smaller stores. If actual conversion rate data isn’t available, use category averages - fashion stores typically see around 1.5%, while Health & Wellness stores average closer to 3.4%. For AOV, calculate the average price of the store’s top 10 products, or look at the catalog to find a representative number.
Let’s break it down with an example: A fashion store gets 100,000 monthly visitors, and the average price of its top products is $65. Using a 1.5% conversion rate, the formula looks like this:
100,000 × 0.015 × $65 = $97,500.
Now, factor in repeat and email-driven sales by multiplying the result by 1.4. This gives you an adjusted estimate of $136,500 per month. This approach pulls together multiple revenue streams for a more complete picture.
Validating Estimates with Benchmarks
Once you’ve calculated your estimate, it’s smart to validate it against industry benchmarks and other indicators. For instance, if a store uses expensive apps like Gorgias or Klaviyo, it’s unlikely they’re earning less than $50,000 per month - those tools wouldn’t make sense financially otherwise. Similarly, if the store is on Shopify Plus, it’s a strong signal they’re pulling in at least $500,000 per month. Multi-factor models that blend traffic, pricing, and app usage tend to hit accuracy rates of 70% to 85%.
You can also refine your estimate with seasonal trends and app usage data. For example, Q4 holiday sales can be up to three times higher than the rest of the year. Combine traffic stats, tech stack insights, and even social proof to get a clearer picture. If something doesn’t add up - like low traffic but high revenue - it’s worth digging deeper. A B2B store, for instance, might have fewer visitors but a much higher AOV, which could explain the discrepancy.
Conclusion
Estimating Shopify store revenue involves piecing together several key metrics. Start by collecting traffic data using reliable tools, then apply conversion rates specific to the store's category. Combine this with the average order value, which you can estimate based on product pricing. Look for indicators like the use of Shopify Plus or premium apps such as Klaviyo and Gorgias - these tools often signal higher revenue since they require significant investment. By putting these elements into the revenue formula and accounting for repeat purchases, you can align your estimates with industry benchmarks, achieving an accuracy range of about 70% to 85%.
However, manually gathering and analyzing this data can be tedious and prone to errors. That’s where StoreCensus simplifies things. With real-time data on over 2.5 million Shopify stores, StoreCensus eliminates the need for manual research. It provides weekly updates and real-time monitoring, ensuring you always have the latest insights.
This streamlined method helps businesses make faster, smarter decisions. For instance, an email marketing agency using StoreCensus filtered Beauty & Personal Care brands earning between $100,000 and $500,000 annually. By identifying gaps like the absence of Klaviyo, they achieved a 35% close rate and boosted their new monthly recurring revenue by 81%.
FAQs
How do I adjust the estimate for repeat purchases?
To refine your revenue estimate with repeat purchases in mind, start by identifying the percentage of revenue generated by repeat customers. Shopify reports can help you with this. Simply divide the revenue from repeat customers by your total sales.
For instance, if repeat customers account for 16.26% of $100,000 in sales, that equals $16,260. Combine this figure with the revenue from one-time customers to get a clearer picture of your overall revenue, factoring in the impact of repeat business.
What’s the best way to pick a conversion rate for a niche store?
The smartest way to determine a conversion rate for your niche store is by looking at industry benchmarks and studying data from stores similar to yours. For most niche stores, conversion rates typically fall between 1% and 3%.
To make more accurate predictions, tools like StoreCensus can be incredibly helpful. They provide insights into comparable stores, helping you refine your estimates based on factors like traffic quality, average order value, and revenue tier. This approach ensures your expectations align with what’s achievable in your specific market.
How can app installs signal a store’s revenue level?
App installs can serve as a clue to a store's revenue potential, as stores generating higher revenue often rely on more apps. For example, stores that attract over 1 million monthly visitors tend to use an average of 4.4 apps. In contrast, smaller stores with fewer than 10,000 visitors generally stick to about 2.2 apps. These additional apps often enhance features, boost marketing, and streamline sales - key strategies typically seen in larger, well-established stores.