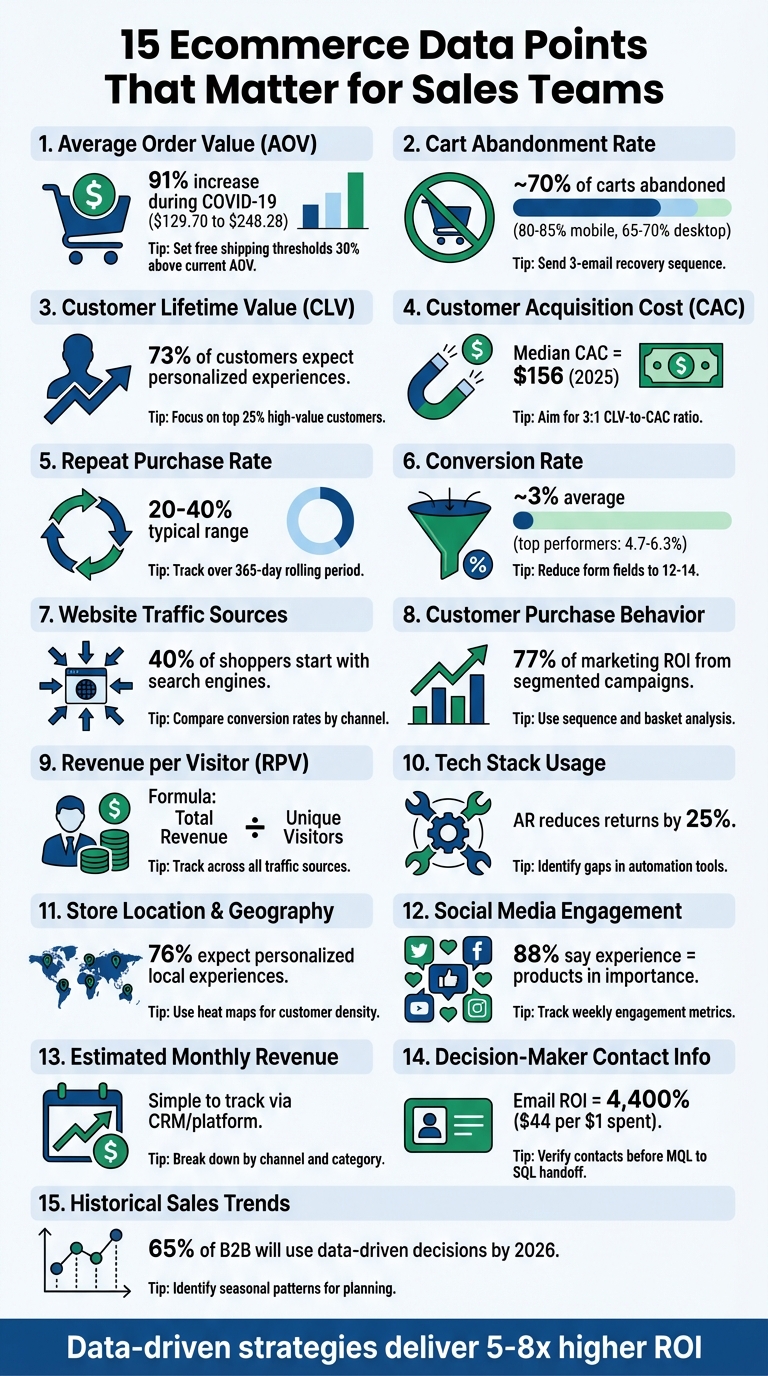
15 Ecommerce Data Points That Matter for Sales Teams
15 ecommerce metrics sales teams must track to boost revenue, reduce churn, and prioritize high-impact prospects.


Ecommerce success hinges on tracking the right data. Sales teams can use these 15 metrics to boost revenue, improve customer retention, and optimize strategies. Here’s a quick look at the most impactful data points:
- Average Order Value (AOV): Measures revenue per transaction. Strategies like free shipping thresholds and product bundling can increase AOV.
- Cart Abandonment Rate: Tracks the percentage of carts left without purchase. Tactics like email reminders and transparent pricing can recover lost sales.
- Customer Lifetime Value (CLV): Shows long-term revenue per customer. Focus on loyalty programs and upselling to maximize CLV.
- Customer Acquisition Cost (CAC): Calculates the cost of gaining a customer. Optimize marketing spend to maintain a healthy CLV-to-CAC ratio.
- Repeat Purchase Rate: Indicates customer loyalty. Use CRM data and loyalty programs to encourage repeat buying.
- Conversion Rate: Tracks the percentage of visitors who make a purchase. Simplify checkout and optimize mobile usability to improve this metric.
- Website Traffic Sources: Reveals where visitors come from. Prioritize high-performing channels for better ROI.
- Customer Purchase Behavior: Analyzes shopping patterns. Use this to create targeted campaigns and product bundles.
- Revenue per Visitor (RPV): Combines conversion rate and AOV. Focus on personalized recommendations and upselling to increase RPV.
- Tech Stack Usage: Evaluates tools and platforms used. Advanced features like AI or AR can enhance performance.
- Store Location and Geography: Highlights regional performance. Tailor marketing and inventory based on local demand.
- Social Media Engagement: Tracks interactions on social platforms. Use engagement data to identify and prioritize leads.
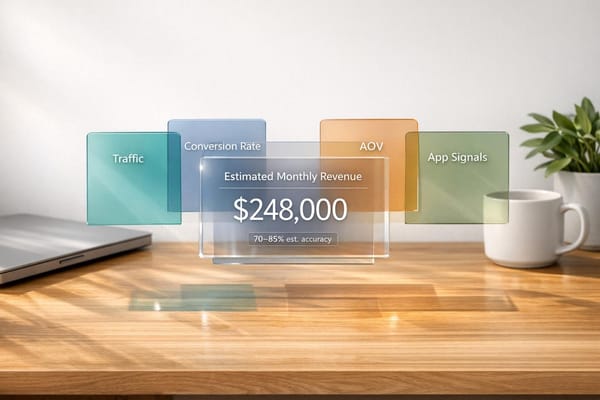
- Estimated Monthly Revenue: Monitors sales performance. Adjust strategies based on revenue trends.
- Decision-Maker Contact Information: Ensures outreach targets the right people. Accurate data reduces wasted effort.
- Historical Sales Trends: Provides insights into seasonal patterns. Plan promotions and inventory based on past performance.
These metrics offer actionable insights to refine your sales approach, allocate resources effectively, and meet customer expectations. Tracking them regularly can lead to smarter decisions and stronger results.
15 Essential Ecommerce Metrics for Sales Teams
1. Average Order Value (AOV)
Sales Impact and Relevance
Average Order Value (AOV) represents the revenue generated per transaction. It’s a key metric because increasing AOV allows you to earn more from your existing traffic without spending extra on acquiring new customers.
During the COVID-19 pandemic, AOV saw a significant rise - from $129.70 to $248.28, marking a 91% increase. More recently, in 2022, ecommerce AOV grew by 31% year-over-year. This increase was influenced by inflation and the growing popularity of buy-now-pay-later services. As Salesforce highlights:
"It costs less to sell more products to existing customers than it does to acquire and sell to new ones".
Actionable Insights for Sales Teams
Brands have implemented creative strategies to boost AOV. For example, Fashion Nova used a tiered spending approach with $25 thresholds and introduced "Shoppable Looks", allowing customers to purchase complete outfits with a single click. Home Depot enhanced AOV by offering professional installation services and protection plans directly on product pages. Similarly, Wayfair bundled product warranties, resulting in a 20% increase in individual order values for certain items.
Another effective tactic is setting free shipping thresholds about 30% higher than your current AOV to encourage larger purchases. Additionally, desktop shoppers tend to spend 48% more than mobile users and 32% more than tablet users, which can guide platform-specific strategies.
These approaches demonstrate how small adjustments can significantly impact revenue.
Direct Relation to Ecommerce Performance
A higher AOV improves financial efficiency by spreading fixed costs - like warehouse labor and marketing - across larger sales volumes. This creates a compounding effect on profitability. Furthermore, 85% of decision-makers believe customer service will play a growing role in driving revenue through cross-selling and upselling opportunities.
Understanding and optimizing AOV is a cornerstone of ecommerce success.
2. Cart Abandonment Rate
Sales Impact and Relevance
The cart abandonment rate tracks the percentage of shoppers who add items to their cart but leave without completing the purchase. Across industries, around 70% of carts are abandoned. This creates a significant revenue loss.
The numbers are even higher for mobile users, with abandonment rates ranging from 80% to 85%, compared to 65% to 70% for desktop users. These shoppers have already shown a strong intent to buy. As Ganit Bar-Dor, Sr. Director of Global Professional Services at Amplitude, puts it:
"People who've added an item to their shopping cart show high intent to buy. When they don't complete their transaction, it might reflect friction in the checkout flow, costing you revenue".
Let’s look at practical ways to recover these lost sales.
Actionable Insights for Sales Teams
A well-timed, three-email sequence can help recover lost revenue. Here's how it works:
- Send a reminder email within the first hour.
- Follow up at 24 hours with added social proof or clarity.
- Offer a small incentive, such as 10% off, within 48–72 hours.
Unexpected costs are a major reason for cart abandonment. To address this, display shipping, taxes, and fees upfront to prevent pricing surprises. Simplify the checkout process by enabling guest checkout as the default and limiting forms to 7–8 fields to reduce user fatigue. Place security badges and clear return policies near the payment fields to ease "payment anxiety".
Direct Relation to Ecommerce Performance
High cart abandonment rates can distort sales forecasts and inventory planning, creating what some call a "planning blind spot". Recovering even a small percentage of these shoppers can significantly boost revenue. Data-driven strategies for reducing abandonment have been shown to deliver a five- to eightfold return on investment. By focusing on lowering abandonment rates, businesses can increase conversions and revenue without needing to spend more on customer acquisition.
3. Customer Lifetime Value (CLV)
Sales Impact and Relevance
Customer Lifetime Value (CLV) measures the total revenue a customer is expected to generate throughout their relationship with a business. This metric is crucial for determining how much can be spent on acquiring customers while still ensuring profitability. Michael Keenan from Shopify sums it up well:
"Knowing how much a customer is worth to your business helps you determine how much you can comfortably spend on customer acquisition and still make a profit".
By segmenting CLV into quartiles, sales teams can identify the top 25% of high-value customers and analyze the traits and behaviors that contribute to their success. This insight is essential for crafting targeted customer engagement strategies.
Actionable Insights for Sales Teams
To maximize CLV, focus on customers who are both frequent buyers and loyal supporters. Regularly compare CLV to Customer Acquisition Cost (CAC); if CAC outweighs the lifetime revenue, it’s time to rethink your approach.
Loyalty programs can play a big role in increasing purchase frequency and boosting CLV. Since retaining and re-engaging current customers is more cost-effective than acquiring new ones, prioritize upselling and cross-selling within high-CLV segments. Also, keep an eye out for signs of churn, like a drop in purchase frequency or smaller order sizes, and address them quickly.
Direct Relation to Ecommerce Performance
Improving CLV doesn’t just enhance customer acquisition strategies - it also strengthens overall sales performance. Building stronger relationships with existing customers is a top priority for many commerce leaders. Consider these statistics: 73% of customers expect businesses to understand their individual needs, and 88% believe the experience a company provides is just as important as its products or services.
To calculate CLV, use this formula: Average transaction size × Number of transactions × Retention period. This calculation helps businesses make informed decisions about marketing budgets and personalized engagement efforts.
4. Customer Acquisition Cost (CAC)
Sales Impact and Relevance
Customer Acquisition Cost (CAC) measures everything a business spends on sales and marketing to acquire a customer - this includes salaries, overhead, and advertising costs. It's a critical metric for assessing whether a business model can grow sustainably. As David Skok, General Partner at Matrix Partners, puts it:
"The second biggest cause of startup failure is: the cost of acquiring customers turns out to be higher than expected, and exceeds the ability to monetize those customers."
For ecommerce businesses, the median CAC in 2025 is $156, though this varies significantly depending on the industry. Some sectors see CAC as low as $72, while premium categories can go as high as $750. Understanding these numbers helps sales teams set realistic goals and quickly identify when acquisition costs deviate from industry norms.
Actionable Insights for Sales Teams
Keeping CAC under control is just as important as monitoring metrics like Average Order Value (AOV) and Customer Lifetime Value (CLV). One effective approach is analyzing CAC by marketing channel. If a particular channel consistently delivers lower CAC, reallocating your budget toward it can improve overall efficiency. Aiming for an optimal CLV-to-CAC ratio (such as 3:1) ensures that customer acquisition costs align with expected revenue.
Real-world examples highlight how businesses can lower CAC while boosting sales. In 2024, the deodorant brand Duradry used Shopify Collabs to partner with 250 social media creators. This move cut their CAC by 29% and generated over $50,000 in product sales. Similarly, Bushbalm addressed a 20% year-over-year drop in ROAS by launching targeted campaigns, which led to a 24% improvement over their previous best-performing efforts.
You can also reduce CAC by focusing on owned channels like email and SMS, which deliver 6–10× ROAS. Referral programs offering small incentives - like $15 store credit instead of the $129 industry average - can lower costs while driving engagement. Additionally, using CRM automation to personalize marketing campaigns cuts down on expensive manual efforts. These strategies not only save money but also create a strong foundation for continuous performance tracking.
Direct Relation to Ecommerce Performance
CAC is deeply tied to a business's profitability and growth potential. To maintain healthy cash flow, businesses should aim to recover acquisition costs within 12 months. Regular monitoring is key - daily checks can catch immediate campaign issues, while weekly or monthly reviews provide insights into broader trends .
The formula for calculating CAC is simple: divide total sales and marketing expenses by the number of new customers acquired . However, context is everything. For instance, a $200 CAC might seem steep until you consider that each customer brings in $600 in lifetime value. This is why it's essential to evaluate CAC alongside the revenue each customer generates, rather than looking at the number in isolation .
5. Repeat Purchase Rate
Sales Impact and Relevance
The repeat purchase rate measures the percentage of customers who make two or more purchases. To calculate it, divide the number of customers with multiple purchases by your total customer count, then multiply by 100 . This metric plays a critical role in driving Customer Lifetime Value (CLV). Why? Because every additional purchase from an existing customer contributes to revenue without the hefty marketing costs tied to acquiring new customers .
Interestingly, 84% of customers place equal importance on the experience they receive and the products they buy. This highlights how customer loyalty - and by extension, repeat purchases - depends heavily on delivering a satisfying experience. For most ecommerce businesses, repeat customer rates hover between 20% and 40%. Companies exceeding this range often benefit from stronger profitability and more consistent revenue streams.
Actionable Insights for Sales Teams
Since the repeat purchase rate is so impactful, what can businesses do to improve it? Here are a few practical strategies:
- Use CRM data to segment customers and send personalized offers. For instance, follow up a running shoe purchase with recommendations for running socks or fitness trackers.
- Introduce loyalty programs that reward repeat purchases with meaningful and achievable perks.
- Offer prompt customer support to address issues quickly and reduce churn.
It’s worth noting that 73% of customers expect companies to understand their specific needs and preferences, making attentive customer service a cornerstone of retention efforts .
Direct Relation to Ecommerce Performance
Improving your repeat purchase rate doesn’t just boost revenue - it also strengthens your overall sales strategy. According to Salesforce, a significant portion of future revenue comes from repeat customers. When this metric improves, it’s a clear sign that your products are meeting customer expectations and your overall experience encourages loyalty .
To get a more accurate picture of long-term trends, track this metric over a 365-day rolling period. This approach accounts for seasonal variations. Additionally, monitoring an early repeat customer rate - such as the percentage of first-time buyers who make a second purchase within 30 or 60 days - can provide valuable insights into how well your brand resonates with new customers.
Since retaining a satisfied customer is far less expensive than acquiring a new one, focusing on improving your repeat purchase rate is one of the smartest ways to drive sustainable revenue growth .
6. Conversion Rate
Sales Impact and Relevance
Conversion rate measures the percentage of visitors who complete a purchase. As Ganit Bar-Dor, Sr. Director of Global Professional Services at Amplitude, puts it: "Conversion is the backbone of all ecommerce businesses - if your organization isn't making money, it won't survive for long".
On average, ecommerce conversion rates hover around 3%, though some benchmarks suggest rates as high as 5.2%. Top-performing stores can see rates between approximately 4.7% and 6.3%. Even small gains can have a big impact - a shift from 2% to 2.5% represents a 25% revenue increase.
Conversion rate also provides insight into the quality of your traffic. A high number of visitors with few purchases often points to issues like poor ad targeting or ineffective messaging. It’s also a valuable diagnostic tool for identifying problems in your sales funnel. For instance, if customers abandon their carts at checkout, you might need to address pain points like lengthy forms or unexpected fees.
Actionable Insights for Sales Teams
Use conversion data to pinpoint where customers drop off. If many add items to their cart but don’t complete the purchase, focus on simplifying the checkout process. Reduce form fields to 12–14, enable guest checkout, and add features like address autofill.
Analyze conversion rates by device type. Desktop users typically convert at a rate of 1.9%, while mobile users average about 1.2%. If mobile traffic dominates but conversions lag, improving mobile responsiveness and offering payment options like Apple Pay or Google Pay can make a difference. Speed is also critical - sites that load in 1 second can achieve conversion rates near 40%, compared to just 18% for sites that take 6 seconds to load.
By addressing these factors, not only can you increase revenue, but you’ll also strengthen the overall efficiency of your sales funnel.
Direct Relation to Ecommerce Performance
Conversion rate is a clear indicator of how well your sales process is working. Higher rates suggest your product pages, checkout flow, messaging, and pricing are all working together to reduce friction and encourage purchases.
7. Website Traffic Sources
Sales Impact and Relevance
Website traffic sources reveal the paths visitors take to reach your ecommerce store - whether it’s through organic search, paid ads, social media, email campaigns, or direct visits. For sales teams, understanding these sources is crucial. It sheds light on where potential customers are coming from and which channels are successfully driving conversions.
"Running an ecommerce business without regularly consulting your data is like spearfishing blindfolded." - Haylee Clark, BigCommerce
By analyzing traffic sources, businesses can make smarter decisions about where to allocate their budgets. For example, tracking conversion rates across different channels can highlight which ones are delivering the best ROI. This kind of insight allows for more targeted strategies that boost both customer acquisition and conversion rates.
Actionable Insights for Sales Teams
Breaking down traffic by source can help identify which channels attract high-intent visitors using ecommerce store intelligence. Compare conversion and bounce rates to determine where your efforts are paying off. If organic traffic is lagging, focusing on SEO improvements could help cut long-term customer acquisition costs. Given that nearly 40% of online shoppers begin their journey with a search engine, improving your organic visibility is essential for sustainable growth.
For paid channels, metrics like cost per click (CPC) and click-through rate (CTR) are key. For instance, the average CTR for Google search ads in ecommerce is 1.66%. Use this data to refine your approach. On social media, if engagement is high but conversions are low, it might be time to tweak your calls-to-action. Similarly, email campaigns with an average open rate of 15.68% can be optimized by experimenting with messaging and timing to better connect with your audience.
Direct Relation to Ecommerce Performance
Traffic source data paints a clear picture of how customers find your store and which marketing channels are driving results. High organic traffic often reflects strong SEO and brand authority, while a solid share of direct traffic points to effective brand recall. Paid channel performance can reveal whether your advertising spend is yielding immediate returns or needs a strategic overhaul. When combined with conversion data, these insights become a powerful tool to refine your overall sales strategy.
8. Customer Purchase Behavior
Sales Impact and Relevance
Understanding customer purchase behavior goes beyond knowing who your customers are. It reveals how they interact with your store - what they browse, which products they pair together, and the order in which they make purchases. This kind of data allows sales teams to segment customers based on real actions rather than assumptions. And it pays off: 77% of marketing ROI comes from campaigns that are finely segmented and targeted based on customer behavior.
For example, spotting friction points like a high rate of cart abandonment enables businesses to take specific actions to address these issues. Behavioral data shines a light on obstacles in the buying process, and removing these barriers can directly boost revenue. It also sets the stage for strategies like upselling and product bundling by providing a detailed understanding of customer actions.
Actionable Insights for Sales Teams
When sales teams analyze customer behavior, they often uncover trends that traditional metrics might miss. These insights pave the way for upselling and cross-selling opportunities. For instance, sequence analysis can reveal the order in which customers typically buy products, while basket analysis identifies items that are frequently purchased together. Armed with this information, you can create product bundles that convert well or recommend complementary items at checkout. If mid-priced products sell better when paired with premium options, consider introducing anchor products to guide purchasing decisions.
Take Ruby Friel, founder of the UK-based retailer Still Life Story, as an example. In December 2025, she used analytics to pinpoint bestsellers and track sales trends, resulting in an impressive 50% year-over-year revenue growth during the Christmas season. Similarly, Northmill leveraged behavioral data to personalize customer journeys, leading to a 30% increase in their conversion rate. These examples highlight how analyzing customer behavior can drive tactical sales strategies and elevate overall ecommerce performance.
Direct Relation to Ecommerce Performance
Behavioral data plays a key role in keeping your store’s visitors engaged and moving closer to making a purchase. Since 53% of online shoppers are more likely to buy from brands that offer personalized experiences, understanding purchase behavior helps you deliver exactly what your customers want. Use this data to track which product categories generate the most revenue, identify underperforming items that may need price adjustments, and flag high-churn customers who might benefit from re-engagement campaigns. By focusing your marketing efforts on the most profitable customer segments and channels, you can maximize ROI and minimize wasted resources.
9. Revenue per Visitor (RPV)
Sales Impact and Relevance
Revenue per Visitor (RPV) measures the average dollar value generated by each unique visit to your website. It combines two critical metrics - conversion rate and average order value (AOV) - to give a more balanced view of your ecommerce store's performance. Interestingly, in a 2020 E-commerce Personalization Report, only 16% of ecommerce leaders identified RPV as their top metric.
Here’s the formula:
RPV = Total Revenue / Unique Visitors
For example, if your site earns $10,000 from 5,000 unique visitors, your RPV would be $2.00. What's great about RPV is its ability to reflect performance even if one metric, like conversion rate, dips - because a higher AOV can still drive up RPV. This makes it an essential tool for analyzing both marketing channels and customer segments.
Actionable Insights for Sales Teams
RPV doesn’t just show you how much revenue each visitor generates - it also helps you figure out where to focus your marketing dollars. Instead of chasing high traffic numbers, use RPV to compare the profitability of different channels. For instance, while social media ads may bring in more visitors, an email campaign might deliver fewer but higher-spending customers, resulting in a better RPV.
To improve RPV, you can focus on boosting both conversion rates and AOV. Use AI-powered product recommendations to personalize shopping experiences. Upselling and cross-selling at checkout can also encourage customers to add higher-value items to their carts. Even small improvements in RPV can have a noticeable impact on your overall revenue.
Direct Relation to Ecommerce Performance
A higher RPV is a strong indicator of better customer engagement and revenue generation. It means your visitors are not only more likely to buy but are also spending more per visit. This reflects effective marketing, appealing products, and a smooth user experience.
To maximize RPV, track it across different traffic sources - search, direct, social, and email. This will help you identify which channels bring in the most valuable visitors. By focusing your resources on the most profitable acquisition paths and cutting back on less effective ones, you can significantly improve your return on investment.
10. Tech Stack Usage
Sales Impact and Relevance
A store's technology foundation plays a crucial role in turning raw data into actionable sales strategies. The tools and platforms an ecommerce business uses can highlight both its strengths and areas for improvement. For instance, stores that adopt Augmented Reality (AR) or AI-driven product recommendations are actively working to lower return rates and boost Average Order Value (AOV). Research shows that integrating AR into digital storefronts can cut product returns by 25%. On the flip side, if a store is missing these advanced capabilities and is grappling with high return rates or low AOV, it presents a clear opportunity for tailored solutions.
Examining a store's CRM or Customer Data Platform (CDP) can also shed light on its ability to deliver personalized marketing at scale. With customer expectations for personalization continuing to rise, businesses without strong automation tools often overspend on acquiring new customers. Additionally, a store's tech stack can reveal whether it employs unified commerce platforms that seamlessly integrate finance, operations, and sales data - or if it's bogged down by siloed systems that limit accurate forecasting. By understanding these technological gaps, sales strategies can be better aligned to address operational inefficiencies.
Actionable Insights for Sales Teams
When analyzing prospects, segment leads based on their technology capabilities. For example:
- If a store lacks loyalty programs or AI-driven recommendations, focus on solutions that can enhance AOV and encourage repeat purchases.
- If a store relies on basic payment gateways like Stripe but experiences high cart abandonment, dig deeper into its checkout process. Often, the problem stems from checkout-related friction - such as hidden fees, no guest checkout option, or slow page load times - rather than the initial cart abandonment.
It's also essential to distinguish between cart abandonment (interest-related) and checkout abandonment (process-related). This differentiation helps pinpoint whether the store needs a more seamless payment solution. Tools like Microsoft Clarity can provide heatmaps to identify where users encounter issues, enabling you to position your solution more effectively.
Direct Relation to Ecommerce Performance
A store's tech stack has a direct impact on its ability to thrive in a competitive market. Businesses that adopt data-driven strategies experience 5 to 8 times higher ROI compared to those that don’t. For example, stores using cloud-based ERP systems that unify finance, inventory, and sales data can quickly adapt to market changes, unlike those relying on outdated, on-premises systems with fragmented data.
Additionally, the growing trend of cookieless browsing is pushing businesses to rethink how they gather shopper data and measure advertising performance. Understanding a prospect's tech stack is more than just a way to sell a product - it serves as a guide to unlocking better performance and long-term growth.
11. Store Location and Geography
Sales Impact and Relevance
Geographic data plays a key role in shaping prospecting strategies and resource allocation. By understanding where an ecommerce store operates and where its customers are concentrated, sales teams can craft pitches that address specific regional challenges and opportunities. Austin Caldwell, Senior Product Marketing Manager at NetSuite, highlights this:
"Knowing a customer's geographic location demonstrates market reach across different regions, countries, and cities. This metric weighs market expansion opportunities, optimizes marketing spend in high-performing regions, and identifies untapped markets with growth potential".
The results of location-based targeting can be impressive. Take Burger King Mexico's 2019 "Traffic Jam Whopper" campaign as an example. Using real-time location data and beacon technology, they sent personalized push notifications to drivers stuck in traffic, targeting customers within a specific delivery radius during peak congestion. The outcome? A 63% increase in delivery orders. This example underscores how geographic intelligence can lead to measurable sales growth and actionable strategies.
Actionable Insights for Sales Teams
Mapping customer density is a great starting point for identifying high-performing regions and spotting underserved markets. Combine purchase data with demographic information - like income, age, or population density - on heat maps to uncover growth opportunities in specific areas. For instance, if a prospect excels in urban markets but has little presence in suburban areas with similar demographics, you can propose solutions to help them expand their reach effectively.
Competitor analysis adds another layer of insight. By comparing competitor and customer density maps, you can pinpoint underserved markets and position your solution as a way to capture these areas before competitors move in. Additionally, analyzing delivery or visit patterns can reveal whether prospects are overestimating their actual market reach - many businesses assume broader coverage than what their data supports.
Direct Relation to Ecommerce Performance
Geographic insights directly affect marketing ROI and operational efficiency. With 76% of consumers expecting personalized experiences from businesses, tailoring strategies based on location is no longer optional - it’s essential for staying competitive. Stores that adapt pricing, inventory, and marketing to regional data consistently outperform those using one-size-fits-all approaches. As Mapline explains:
"Understanding your customers isn't just about knowing who they are - it's about understanding where they are, how they move, and how their environment shapes their decisions".
With U.S. retail ecommerce sales projected to surpass $1.6 trillion by 2028, accounting for 20% of total retail sales, using geographic data to optimize operations and marketing will be crucial for capturing market share. Sales teams equipped with these insights can guide prospects on how to allocate resources efficiently, reduce wasted marketing spend in underperforming areas, and uncover new opportunities aligned with customer behavior. Geographic intelligence, when combined with other ecommerce metrics, provides a well-rounded, data-driven approach for driving sales success.
12. Social Media Engagement
Sales Impact and Relevance
Social media engagement offers sales teams a valuable glimpse into early sales opportunities. When prospects interact with your social content - whether by liking, sharing, commenting, or clicking - they’re signaling interest well before filling out a contact form. This kind of interaction provides a treasure trove of data for identifying and targeting potential leads and gauging their intent. Considering that 73% of customers expect companies to understand their unique needs and 88% believe the experience a company delivers is just as important as its products or services, tracking these interactions is key to crafting personalized and impactful sales conversations.
It also highlights which messages resonate most with your audience. By analyzing detailed engagement data, sales teams can fine-tune their pitches to better align with the preferences of high-intent prospects.
Actionable Insights for Sales Teams
To turn engagement into actionable sales insights, start by tracking weekly metrics like likes, shares, comments, and clicks. This data helps pinpoint when prospects shift from passive observers to active participants. Break down conversion rates by platform - comparing, for instance, Facebook ads to LinkedIn posts - to identify which campaigns deserve more investment and which audiences are most responsive to your messaging.
Engagement data also helps prioritize outreach. Prospects who frequently share your content or leave positive comments often act as promoters and should be prioritized for follow-ups. Reviewing a lead’s recent interactions can guide sales teams in sharing timely, relevant information that complements their interests. This approach tackles a common issue: over 70% of leads are lost because they’re handed to sales teams before the customer is ready to buy.
Direct Relation to Ecommerce Performance
Social media engagement doesn’t just build connections - it directly impacts revenue. By tracking how interactions lead to purchases, sales teams can link engagement data to tangible outcomes. Distinguishing between organic engagement (driven by content quality and word-of-mouth) and paid engagement (boosted by advertising spend) is essential for accurately assessing marketing ROI. With the average ecommerce conversion rate hovering around 3%, understanding which social platforms yield higher-than-average conversions allows businesses to allocate resources more effectively.
Retailers using AI-powered analytics to analyze social data and campaign performance gain an edge. These tools can help pinpoint bestsellers and adjust inventory based on real-time customer feedback, transforming engagement metrics into actionable sales strategies.
When paired with metrics like average order value (AOV) and conversion rates, social media engagement provides a well-rounded view of overall sales performance.
13. Estimated Monthly Revenue
Sales Impact and Relevance
Estimated monthly revenue is a key indicator of your business's sales performance and overall health. It acts as a checkpoint for evaluating whether your sales strategies are hitting the mark and helps in setting realistic quotas. If your team’s performance shifts, quotas can be adjusted accordingly to stay aligned with your goals. This metric also highlights which customer segments are the most profitable, enabling sales teams to prioritize high-value leads over those with less potential. While some businesses aim for a benchmark of $100,000 per month, your specific targets should reflect your growth ambitions and market conditions.
Actionable Insights for Sales Teams
Revenue targets provide clear, actionable steps for sales teams. For example, if your monthly revenue goal is $10,000 and your Average Order Value (AOV) is $45, you’ll need to bring in at least 222 customers to meet that target. These kinds of calculations help define customer acquisition goals and guide resource allocation. Additionally, analyzing revenue trends can uncover bottlenecks in your sales funnel or issues with lead quality, prompting timely adjustments to your strategies and budgets.
Ease of Tracking or Measurement
Monitoring monthly revenue is straightforward, thanks to tools built into most ecommerce platforms like Shopify or WooCommerce, as well as CRM systems. These platforms often automate revenue tracking and can even compare current performance against predictive models based on historical data. This real-time analysis makes monthly revenue one of the simplest yet most critical metrics to keep an eye on.
Direct Relation to Ecommerce Performance
Monthly revenue provides a clear snapshot of your business’s health and serves as a vital KPI for tracking progress toward specific goals. Breaking this metric down further - by sales channel (such as organic search, social media, or email) or product category - can reveal which strategies are driving growth. Don’t forget to account for merchandise returns when calculating net revenue, as this gives a more accurate picture of your earnings. When combined with other data points, monthly revenue helps refine your priorities and sharpen your sales focus.
14. Decision-Maker Contact Information
Sales Impact and Relevance
Having the right contact details for decision-makers can completely change how your sales team operates. When you know exactly who has the authority to make purchasing decisions - like a Head of Procurement or an Ecommerce Manager - you skip the guesswork and go straight to the people who can approve a deal. This approach isn't just efficient; it also cuts down on your Customer Acquisition Cost (CAC) by avoiding wasted time on the wrong contacts. Here's a standout stat: email marketing aimed at the right decision-makers can deliver an ROI of 4,400%, meaning $44 earned for every $1 spent. This kind of precision sets the stage for focused and effective sales efforts.
Actionable Insights for Sales Teams
Centralizing decision-maker information in your CRM gives your team the tools to target outreach based on job title, company size, or industry. Before passing leads from Marketing (MQLs) to Sales (SQLs), verify their contact details - this small step can significantly improve both efficiency and conversion rates. Also, pay attention to each contact's preferred communication method, whether it’s email, phone, or SMS, to tailor your outreach. To keep your data fresh, set a "last review date" in your CRM and perform regular updates to ensure accuracy.
Ease of Tracking or Measurement
Gathering decision-maker contact details is easier than ever with tools like website lead forms, email opt-ins, and online sales ledgers. Modern CRMs can automatically capture key details - like job titles and locations - when new contacts are added, simplifying the tracking process. Browser extensions and email verification tools also make it possible to validate contact information in real time while browsing an ecommerce site or LinkedIn profile. High-quality email verifiers can guarantee delivery rates of 97% or more, reducing bounce rates to below 3% for verified addresses. For example, StoreCensus' CRM integrates real-time updates and automated workflows to keep decision-maker data accurate and up to date.
Direct Relation to Ecommerce Performance
Accurate decision-maker contact information plays a critical role in turning leads into customers. It ensures that your team is engaging with the right people - those who actually have the authority to make purchasing decisions. In B2B scenarios, focus on identifying key roles, while in B2C, pay attention to individual buying behaviors. With verified contact details, your sales team can create personalized outreach strategies that not only streamline the sales process but also boost conversion rates.
15. Historical Sales Trends
Sales Impact and Relevance
Looking at historical sales trends is like having a crystal ball for your business. Instead of relying on guesswork, you can base decisions on solid, data-driven insights - something 65% of B2B businesses are expected to embrace by 2026. These trends reveal seasonal patterns, like Black Friday surges or slower summer months, allowing you to plan ahead for promotions. This kind of foresight helps with everything from budgeting and inventory planning to staffing. In short, past sales data transforms into a roadmap for future strategies.
Actionable Insights for Sales Teams
Historical data isn't just about looking back; it’s about planning smarter. For instance, during slower sales periods, you can launch targeted promotions or new products to keep revenue steady. If certain products performed exceptionally well in the past, feature them prominently on your website during similar seasons. On the flip side, if current metrics like cart abandonment or churn rates deviate from historical averages, it might signal a technical issue or a shift in the market. For underperforming products, trend data can guide decisions about pricing or bundling to make them more appealing.
Ease of Tracking or Measurement
Tracking historical sales trends is easier than ever with modern tools. For example, Shopify analytics helped Still Life Story achieve a 50% year-over-year revenue increase during Christmas by identifying their top-performing products. Swappie, a refurbished phone platform, used a BigQuery warehouse to combine online and offline data, running budget simulations that boosted their Return on Ad Spend (ROAS) by 15%. Tools like StoreCensus' CRM go even further, tracking sales data by the hour, day, week, and month, uncovering patterns that inform future strategies.
Direct Relation to Ecommerce Performance
Historical sales trends are like the anchor of your ecommerce strategy. They help you evaluate whether your current growth is sustainable or if you need to pivot. By analyzing past performance, you can pinpoint what drives sales, replicate your successes, and avoid repeating mistakes. These insights complete the puzzle, ensuring your strategies are grounded in proven results.
KPIs and Metrics for eCommerce | Evaluate Your eComm Performance
How to Track These Data Points
Tracking key ecommerce metrics effectively is crucial for turning raw data into actionable sales strategies. When your data is centralized, monitoring these 15 essential data points becomes much easier. StoreCensus simplifies this process by consolidating insights from over 2.5 million stores and more than 25 data points. This unified approach ensures seamless access to real-time insights and streamlines your decision-making process.
With real-time tracking, you can respond quickly to market changes. StoreCensus provides live updates on store performance, revenue trends, and customer behavior. Its real-time dashboards let you identify trends as they emerge - whether it’s a sudden increase in cart abandonment or a shift in traffic sources. These insights allow you to adjust your strategies instantly, ensuring you stay ahead of the curve.
CRM integration is another powerful tool for unifying your data. By combining website metrics, customer interactions, and mobile data into a single view, you can pinpoint Sales Qualified Leads who are ready to make a purchase. StoreCensus’s built-in CRM (available with Professional plans and higher) enriches lead profiles automatically, adding details like decision-maker contact information and historical sales data. This eliminates tedious manual entry, freeing your team to focus on high-value prospects.
Automation takes things a step further by turning your data into immediate, actionable steps. StoreCensus enables you to create automated workflows that trigger specific actions when conditions are met - like when a store reaches a certain revenue milestone or adopts a new technology. Given that 73% of customers expect businesses to understand their unique needs, these automation tools help you deliver personalized outreach at scale without losing the human touch.
Finally, predictive analytics bring even more power to your sales strategy. By analyzing past performance, predictive tools can forecast outcomes like Customer Lifetime Value, helping you allocate resources more effectively. Companies that embrace data-driven strategies report five to eight times higher ROI compared to those that don’t. Predictive capabilities like these are essential for staying competitive in today’s fast-paced ecommerce landscape.
Conclusion
Tracking the right ecommerce metrics takes the guesswork out of growth. As Peter Drucker once said:
"If you cannot measure it, you cannot improve it".
The 15 metrics we’ve discussed give your sales team a detailed understanding of customer behavior, business performance, and potential revenue opportunities. From Average Order Value (AOV) to historical sales trends, these numbers transform raw data into actionable strategies.
Data-driven strategies aren’t just helpful - they’re game-changing. Businesses that use them see five to eight times higher ROI compared to those that don’t. And with Gartner projecting that 65% of B2B companies will rely on data-driven decisions by 2026, adopting these practices now sets you ahead of the curve.
Start by setting clear objectives for your sales team. Whether it’s lowering Customer Acquisition Costs or increasing Repeat Purchase Rates, define specific KPIs that align with your business goals. Even tracking basic metrics in a simple spreadsheet is better than operating without direction. As you gain confidence with the data, you can expand and refine your approach.
By integrating these metrics into your strategy, every decision becomes purposeful. Pinpoint friction in your customer journey, allocate marketing budgets based on real results, and tailor your outreach to meet customer needs. Tools like StoreCensus simplify this process, offering insights from over 2.5 million stores to help you focus on the data that matters most.
Every day you wait is a missed opportunity - lost leads, untapped revenue, and valuable insights left on the table. Start tracking these 15 ecommerce metrics today, and shift your sales strategy toward proactive, data-driven success.
FAQs
What are the best strategies for sales teams to increase Average Order Value (AOV)?
Sales teams looking to increase Average Order Value (AOV) can rely on a handful of effective strategies designed to encourage customers to spend more during each transaction. Here are some methods worth considering:
- Bundle products: Combine complementary items into discounted packages. For example, pairing a laptop with a protective case or a skincare set can entice customers to purchase both instead of one.
- Upselling and cross-selling: Offer higher-priced alternatives or suggest related products during checkout. For instance, recommending a premium version of a product or accessories that go well with the main item can increase the overall purchase value.
- Incentives: Create enticing offers like free shipping for orders over a certain amount (e.g., "Free shipping on orders over $50") or volume discounts to encourage customers to add more to their carts.
- Limited-time offers: Use time-sensitive deals to create urgency. Promotions like “Get 20% off today only” can prompt customers to make larger purchases before the opportunity ends.
- Personalized recommendations: Tap into customer data to suggest products tailored to their preferences or past buying habits. Whether it’s showing a matching item or a frequently bought-together suggestion, personalization can make a big difference.
By implementing these strategies, sales teams can not only drive up revenue per transaction but also create a shopping experience that feels tailored and rewarding for customers.
How can ecommerce businesses reduce cart abandonment rates effectively?
Reducing cart abandonment starts with making the checkout process as straightforward as possible. Keep the steps to a minimum and include a clear progress bar so customers know exactly where they are in the process. Also, be upfront about all costs - hidden fees that pop up at the last minute are a surefire way to lose a sale.
Since a large number of shoppers use their phones, ensure the entire shopping experience is smooth and user-friendly on mobile devices. Offering options like guest checkout and multiple payment methods can also eliminate friction and make it easier for customers to complete their purchases. On top of that, sending personalized abandoned-cart emails at the right time - especially ones that include perks like discounts or free shipping - can be a powerful way to win back lost sales.
Psychological tactics can also play a role. Highlighting scarcity with phrases like “Only 2 left in stock!” or using visuals and descriptions to help customers picture the product as theirs can nudge them toward completing their purchase. By blending these strategies, businesses can lower cart abandonment rates and boost conversions effectively.
Why is Customer Lifetime Value (CLV) important for ecommerce businesses?
Customer Lifetime Value (CLV) matters because it reveals the total revenue a customer is likely to bring to your business throughout their entire relationship with you. This metric gives ecommerce teams the ability to focus on high-value customers, refine their marketing strategies, and create loyalty programs that encourage repeat business and long-term growth.
When businesses prioritize CLV, they move beyond short-term sales targets and focus on building sustainable profitability. It also helps allocate budgets more effectively for customer acquisition and retention, ensuring investments are directed toward areas that maximize revenue and enhance customer satisfaction.